On Friday, CMS posted its latest drafts of the cost transparency rule for hospitals and payers. The agency plans to display the following information about each hospital-based shoppable service: a plain-language description, the payer-specific negotiated charge, a list of all the associated ancillary items and services that the hospital provides with the shoppable service, the location at which each shoppable service is provided, and any primary code used by the hospital for purposes of accounting or billing. Payers will be expected to make the following data elements available: claims payment policies and practices, periodic financial disclosures, data on enrollment, data on disenrollment, data on number of claims that are denied, data on rating practices, information on cost sharing and payments with respect to any out-of-network coverage, and information on enrollee and participant rights. For a covered item or service, the payer would need to disclose the following content elements “in plain language:” estimated cost-sharing liability, accumulated amounts (e.g., deductible, out-of-pocket limit), negotiated rate, out-of-network allowed amount, items and services content list (for bundled payment arrangements), notices of prerequisites to coverage, and disclosure notice.
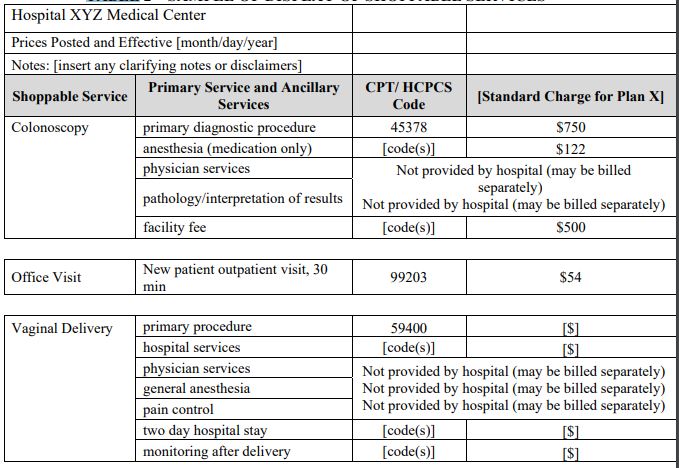
Here’s a sample of what CMS expects to show patients/consumers:

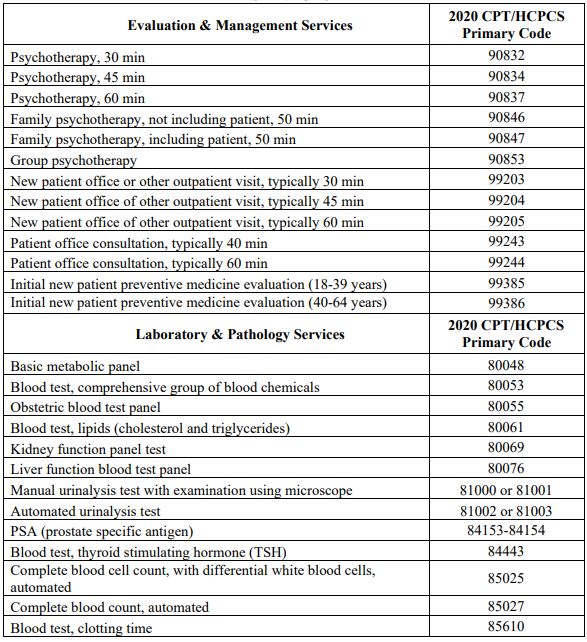
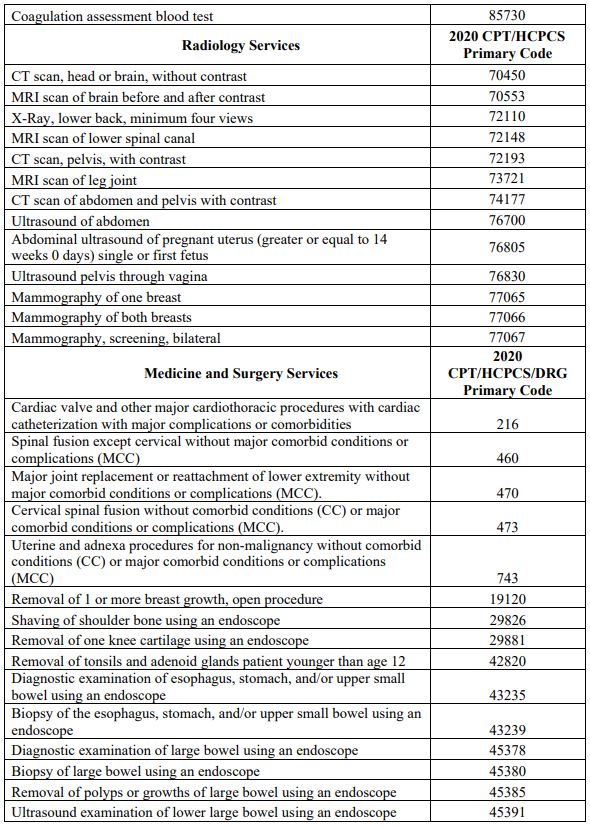
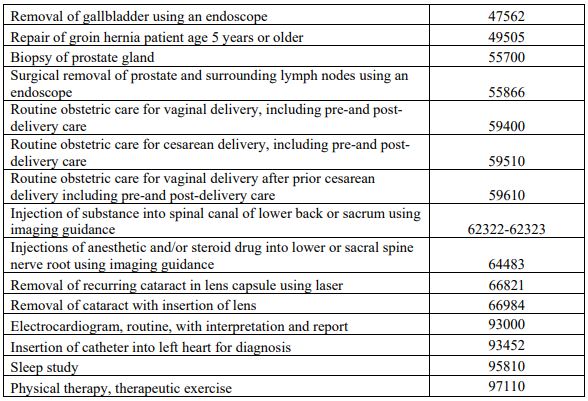
Here are the 70 services CMS plans to include (the other 230 will be defined by hospitals):


CMS points to a 2014 publication showing that individuals who shop for clinical services can save nearly $125 on advanced imaging services, $3.45 for laboratory tests and $1.18 for clinician office visits. Interestingly, that publication found that claims payments were lower for searchers were lower than non-searchers, even if there was no cost sharing. Simply posting hospital prices appears to reduce the rate of charge growth among included DRGs somewhere between two and nine percent. Kentucky provides patient rewards for service shopping (e.g., up to $500 for a hip replacement, $150 for a colonoscopy, $150 for a cataract removal, and $25 for a mammogram). Between 2010 and 2013, one grocery chain with a $1200 annual deductible with 20% coinsurance for its employees was able to reduce laboratory spend over 30% using a combination of price transparency and reference pricing at 60% of each region’s negotiated prices for a subset of laboratory tests that were ordered under specific circumstances.
There are several concerns around the agency’s proposed approach. Patients are not as informed as buyers of healthcare goods and services compared to providers and health systems selling those goods and services. Some have suggested that patients would be better served by viewing an estimate of their total expected costs instead of the payer-specific negotiated charge. Patients may also be reluctant to disrupt their relationship with their primary care provider to save a few dollars and potentially disrupt the continuity of care within a specific medical center. In January 2019, Chernew et al. found that the referring physician’s recommendation was more important than cost-sharing or home ZIP code when choosing a lower-limb MRI scan provider. Besides being difficult to interpret, prices listed on chargemasters are poorly correlated with prices patients might have to pay if they do not have insurance or are out-of-network. Others are concerned that a lack of accompanying quality information might encourage consumers to believe that higher price is linked to higher quality (there are parallels to understanding the value of attending different colleges). In Japan, price transparency revealed relatively low prices, encouraging patients to request more services.
Our experience with exposing pharmaceutical price information may be informative. Arrangements between pharmacy benefit managers (usually affiliated with specific health insurance companies) and pharmaceutical manufacturers are opaque to end-users. Higher prices can induce higher rebates that result in better formulary placement. One retrospective study published in August 2019 found drug discount programs saved about $18/prescription without price transparency. Another study found that displaying pharmaceutical pricing information to providers did not result in a sustained change in institutional expenditure (there are similar findings with exposing radiology test price information to primary care providers and specialists).
Sinaiko and Rosenthal reviewed utilization of Aetna’s Member Payment Estimator (including over 650 medical services) among a commercial population in 2011-12. The Estimator asks for the family member for whom the search is being conducted, the provider’s ZIP code, and the service or type of physician needed. In 2012, the Estimator would return up to 10 results per query. During those two years, fewer than two percent of members used the Estimator. Among the services that members searched the Estimator, vaginal delivery or cesarean section, tonsillectomy (with or without adenoidectomy), total knee replacement and inguinal herniorrhaphy prices appeared to viewed most frequently among those members who actually had the procedure performed within 180 days of the search. On a related note, 59% of searches returned a price estimate for only one provider. Desai et al. published similar results in JAMA (2016) and Health Affairs (2017).
Some groups are currently operating without a federal mandate. New Hampshire, Florida, and Massachussetts have published online tools to help their residents understand healthcare prices (until recently, California had a working price comparison website). Healthcare Bluebook, an employer-focused website with some functionality for consumers, suggests that up to 30% of a company’s healthcare costs come from shoppable procedures. They have sections for hospital services, physician visits, imaging, labs, cosmetic medicine, hearing aids, dental and medications. The website links to GoodRx for prescriptions and MDsave for physicians who can perform a procedure. The website lists procedures separately, so facilities that are the least expensive for screening colonoscopy may be different than colonoscopy with biopsy. Although the website describes its efforts to stratify service providers by quality, my review of the consumer-facing portions of the website not linked to an employer sponsor did not reveal any quality ratings.
So what can we take from all of these findings? First, there are structural challenges to encouraging patients to use pricing information to make more cost-effective healthcare decisions that are not addressed by the proposed CMS rules. State and private efforts to emphasize price transparency have been poorly adopted by the general public. Second, there may be some actions that groups can take to promote cost-based choices among patients acting as consumers. Reference pricing may be more effective than rewards programs. Sinaiko, Kakani and Rosenthal estimated marketwide price information used to steer members to lower-price providers with a price ceiling at the 75th percentile of statewide prices could generate 9-12.8% savings in Massachussetts. Kricher, Royce et al. suggest price transparency be accompanied by:
- All states developing all-payer claims databases (APCDs),
- Cost data being interpretable and inclusive,
- Standardized, evidence-based quality metrics being incorporated into transparency models to account for value, and
- Minimal cost sharing for procedures below the median of APCDs and deemed to be of high value.
Another approach to price transparency might focus on separate reference pricing for definitive diagnosis, initial treatment after diagnosis, and long-term surveillance. A singular focus on unit pricing may not account for quality within each of those episodes. A low-price radiology image could lead to a missed diagnosis and larger total cost of care. Although laboratory and radiology testing in themselves may be a small portion of an organization’s overall healthcare spend, those diagnostic services may drive utilization in other spending silos (e.g., medication, office visits). Payers and employers could evaluate the outcome of each care segement (diagnosis, treatment, surveillance) using cost, satisfaction, quality-of-life or any other member/employee-preferred metric. The recategorization of healthcare goods and services (e.g., expected costs for managing a pregnancy from conception to vaginal delivery versus separate line items for blood test panels, ultrasound of a pregnant uterus and vaginal delivery) would translate existing healthcare encounter codes and procedure codes into customer-friendly units of analysis. Separating healthcare into diagnosis, treatment and surveillance could also help patients conceptualize their care as blocks that could be managed by separate face-to-face or digital entities.