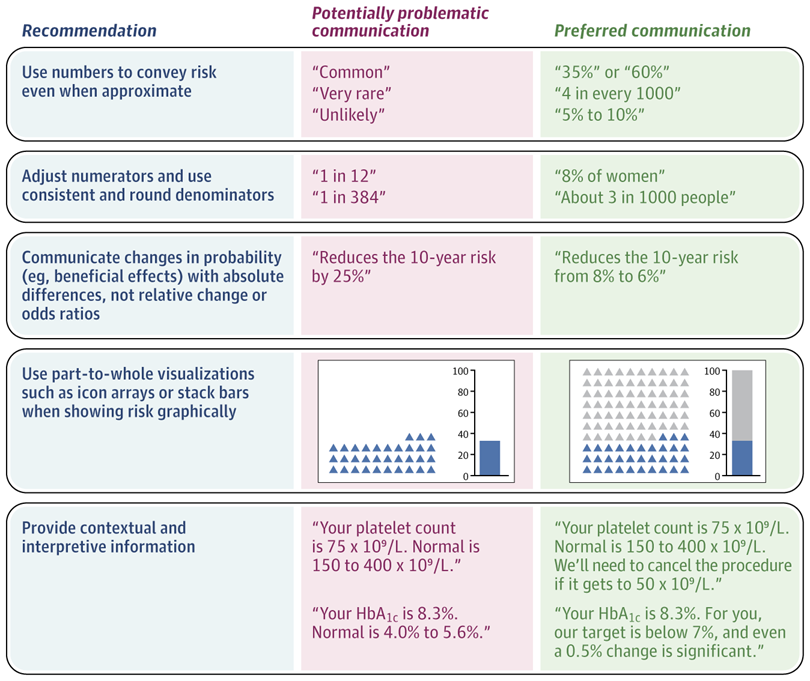
“First, numbers (even if approximate) should be used to describe risk probabilities. The meaning of verbal probability terms (eg, rare, common, or unlikely) varies among people and situations. A systematic review of 24 studies found that people interpreted “rare” to mean probabilities ranging from 0% to 80%, while interpretations of “common” ranged from 10% to 100%. Using numbers helps patients understand whether a rare risk is 4% or 0.004%. [..] One caveat to this recommendation is that nonnumeric communication may be appropriate when it is more important that a patient understands a category (eg, that their risk is “high”) than the exact likelihood.
Second, consistent risk denominators should be used when discussing numerical data with patients instead of a 1-in-X format in which the denominator varies while the numerator is fixed at 1 (eg, a 1 in 384 risk of trisomy 18). [..]
Third, differences in probability generally should be presented using absolute differences instead of relative reduction or increases. [..] for patients to understand the magnitude of benefits and risks associated with specific treatments, patients need to be presented with absolute risk differences, even if these data are approximate. For example, “this treatment reduces your risk from roughly 15% to maybe 7% to 8%” is preferable to stating that it “cuts the risk in half” or “results in a 50% risk reduction.”
Fourth, visual displays of probability should show both the numerator and the denominator of this ratio. Both icon array formats that use 100 icons in a matrix and stacked bar formats accurately represent this part-to-whole relationship, whereas bar charts do not, especially if scaled to less than 100%. [..]
Fifth, contextual information should be provided for numbers that may be unfamiliar to patients (eg, biomarker levels). For example, in a study of 1618 US adults, providing a visual line display of creatinine levels with a threshold for concern (3.0 mg/dL labeled “many doctors are not concerned until here”) reduced concern for a result of 2.2 mg/dL vs an identical display lacking this threshold, yet the presence of the threshold label did not significantly change reactions to a more extreme value of 3.4 mg/dL. Beyond normal or standard ranges, discussing target values, action thresholds, and/or clinically significant difference information enables patients to understand their data and their clinical relevance.”
Full article, BJ Zikmund-Fisher, A Thorpe and A Fagerlin, JAMA, 2025.9.24