National Health Expenditures, 2012-18 Exhibit 1
National Health Care Spending In 2018: Growth Driven By Accelerations In Medicare And Private Insurance Spending Health Affairs (2019.12.5)
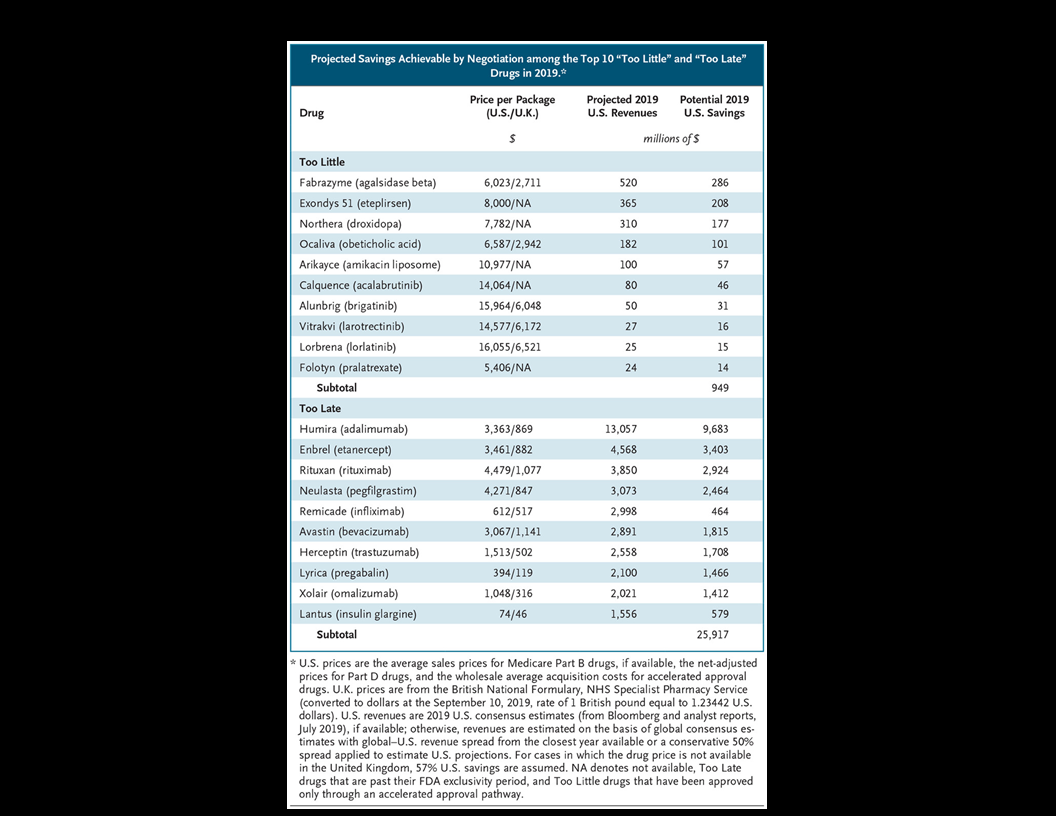
Which Drug Prices Should Medicare Negotiate? A “Too Little” or “Too Late” Approach
“This brief analyzes Medicaid enrollment and spending trends for FY 2019 and FY 2020 based on interviews and data provided by state Medicaid directors as part of the 19th annual survey of Medicaid directors in all 50 states and the District of Columbia.
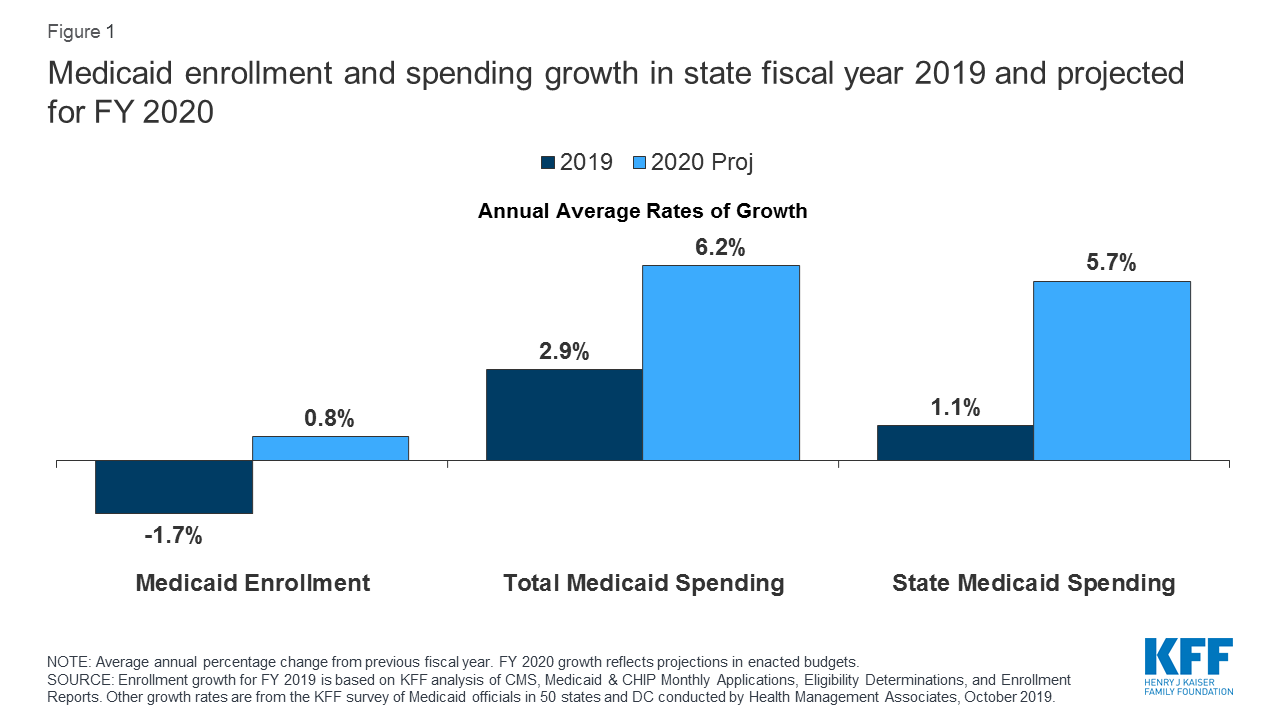
[..] Medicaid (together with CHIP) provided coverage to about one in five Americans, or about 72 million people, as of July 2019. Total Medicaid spending was $593 billion in FY 2018 with 62.5% paid by the federal government and 37.5% financed by states. Medicaid accounts for one in six dollars spent in the health care system and more than half of spending on long-term services and supports.
[..] State spending growth for Medicaid typically outpaces overall state general fund growth as medical costs have historically grown faster than inflation. During the first three years of ACA implementation (2014-2016), however, state spending for Medicaid grew at a slower pace compared to overall state general fund growth, likely due to the enhanced federal match rate for expansion adults that covered the full cost of the expansion in those years as well as slower growth in health costs generally, and the improving economy. While data in this report reflect state spending from general fund and other state sources, states reported estimated state Medicaid spending growth of only 1.1% in FY 2019 compared to 5.8% general fund expenditure growth (as reported by NASBO). NASBO data also show state Medicaid general fund spending growing at a slower rate (3.6%) compared to total general fund spending (5.8%).”
Medicaid Enrollment & Spending Growth: FY 2019 & 2020 | The Henry J. Kaiser Family Foundation (2019.10.18)
“Our analysis is based on unit prices that do not reflect manufacturer rebates and discounts to plans, which are considered proprietary and therefore not publicly available; the Senate Finance Committee inflation rebate proposal is also based on list prices (Wholesale Acquisition Cost), while the House proposal is based on Average Manufacturer Price, which may include some discounts to wholesalers but not rebates paid to plans and PBMs.
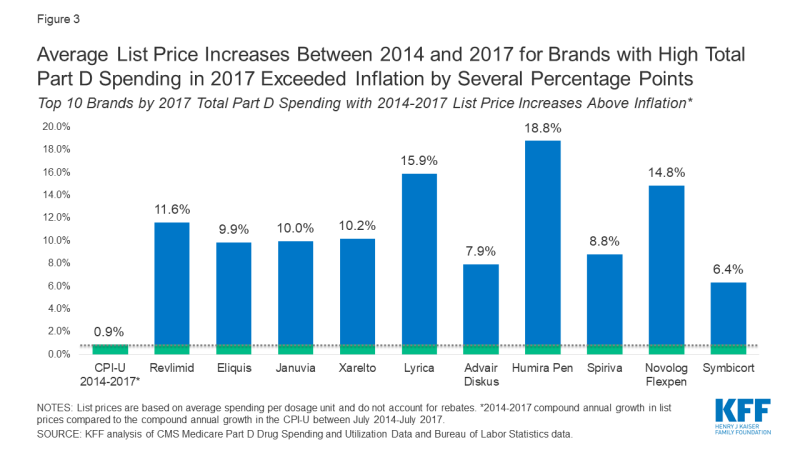
[..] Focusing on the top 25 drugs by total Medicare Part D spending in 2017, all of which were brand-name drugs, 20 had list price increases between 2016 and 2017 above the inflation rate. For these 20 drugs, price increases ranged from 3 times to more than 9 times the rate of inflation.
Among the top 10 of this subset of drugs, list price increases exceeded the inflation rate by several percentage points, including four drugs with double-digit increases: 15.7% for Lyrica, a pain medication used by 0.9 million Part D enrollees in 2017; 15.3% for Revlimid, a cancer medication used by 37,000 enrollees; 13.2% for Humira Pen, for rheumatoid arthritis, taken by 52,000 enrollees; and 11.0% for Novolog Flexpen, an insulin therapy used by nearly 550,000 enrollees. Four of these 10 drugs are taken by roughly one million or more Part D enrollees (Eliquis, Xarelto, Advair Diskus, and Symbicort).”

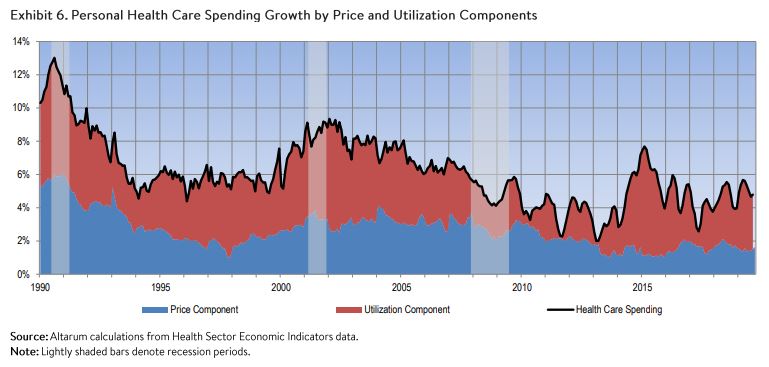
“In August 2019, health spending reached a seasonally adjusted annual rate of $3.87 trillion, slightly above its July value of $3.85 trillion. August’s health spending accounted for 17.9% of GDP. Hospital spending was $1.267 trillion (33%). Physician and clinical services was $758 billion (20%).”