| Tracer | Indicator |
|---|---|
| Family planning | Demand satisfied with modern methods in women aged 15-49 years who are married or in a union |
| Pregnancy and delivery care | Four or more visits to antenatal care |
| Child immunization | Children aged 1 year who have received three doses of a diptheria, tetanus, and pertussis vaccine |
| Child treatment | Care-seeking behavior for children with suspected pneumonia |
| Tuberculosis treatment | Tuberculosis effective treatment coverage |
| HIV treatment | People with HIV receiving antiretroviral therapy |
| Malaria prevention | Population at risk who sleep under insecticide-treated bednets |
| Water and sanitation | Households with access to at least basic sanitation |
| Prevention of cardiovascular disease | Prevalence of non-raised blood pressure regardless of treatment status |
| Management of diabetes | Mean fasting plasma glucose |
| Cancer detection and treatment | Cervical cancer screening in women aged 30-49 years |
| Tobacco control | Adults aged at least 15 years who had not smoked tobacco in the previous 30 days |
| Hospital access | Number of hospital beds per person |
| Health-care worker density | Number of health professionals per person (physicians, psychiatrists, and surgeons) |
| Access to essential medicines | Proportion of health facilities with availability of the WHO-recommended core list of essential medicines |
| Health security | International Health Regulations core capacity index |
Monitoring universal health coverage within the Sustainable Development Goals: development and baseline data for an index of essential health services, Lancet Global Health 2017.12.13
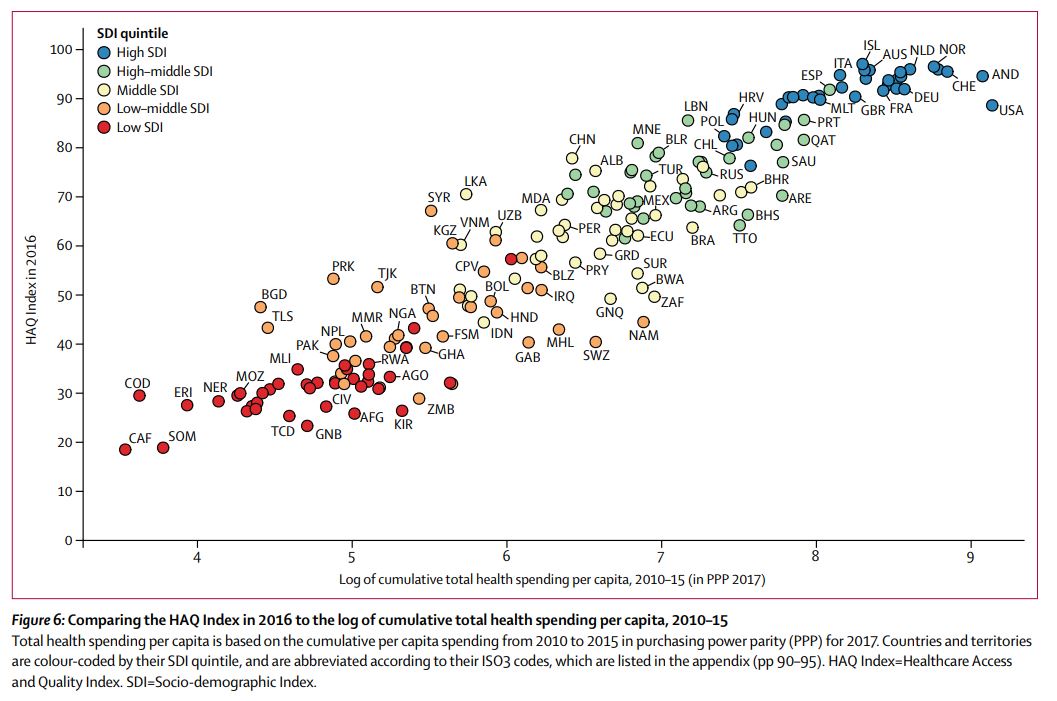
Measuring performance on the Healthcare Access and Quality Index for 195 countries and territories and selected subnational locations: a systematic analysis from the Global Burden of Disease Study 2016, Lancet 2018.5.23
| Cause | Amenable age range (years) |
|---|---|
| Tuberculosis | 0-74 |
| Diarrheal disease | 0-14 |
| Lower respiratory infections | 0-74 |
| Upper respiratory infections | 0-74 |
| Diptheria | 0-74 |
| Whooping cough | 0-14 |
| Tetanus | 0-74 |
| Measles | 0-14 |
| Maternal disorders | 0-74 |
| Neonatal disorders | 0-74 |
| Colon and rectal cancer | 0-74 |
| Squamous-cell carcinoma | 0-74 |
| Breast cancer | 0-74 |
| Cervical cancer | 0-74 |
| Uterine cancer | 0-44 |
| Testicular cancer | 0-74 |
| Hodgkin’s lymphoma | 0-74 |
| Leukemia | 0-44 |
| Rheumatic heart disease | 0-74 |
| Ischemic heart disease | 0-74 |
| Cerebrovascular disease | 0-74 |
| Hypertensive heart disease | 0-74 |
| Chronic respiratory diseases | 1-14 |
| Peptic ulcer disease | 0-74 |
| Appendicitis | 0-74 |
| Inguinal, femoral and abdominal hernia | 0-74 |
| Gallbladder and biliary diseases | 0-74 |
| Epilepsy | 0-74 |
| Diabetes mellitus | 0-49 |
| Chronic kidney disease | 0-74 |
| Congenital heart abnormalities | 0-74 |
| Adverse effects of medical treatment | 0-74 |
“For the present study, we based the HAQ Index on the list of causes established by Nolte and McKee, and did not systematically re-examine scientific literature to update causes for which personal health care can significantly improve outcomes. Conducting this kind of systematic review is crucial to identifying additional causes for inclusion in the HAQ Index. Numerous causes should be considered, and would likely result in adding antiretroviral therapy for HIV, artemisinin-based combination therapies for malaria, treatment of hepatitis C, and improvements in emergency and trauma care, among others. Expanding the amenable cause list should be determined by clear criteria that define when health care sufficiently reduces cause-specific mortality and thus provides a strong enough signal about access and quality. Such additions will probably improve the HAQ Index, though the nature of PCA estimation and its measurement of common variance across 32 causes may not substantially change future results. This analysis stemmed from existing scientific literature on mortality amenable to health care, but personal health care also can have profound effects on non-fatal health outcomes (eg, hip replacement for oesteoarthritis or surgery for cataracts). Future updates of the HAQ Index should consider incorporating measures of non-fatal conditions amenable to personal health care, which would then capture health-system capacity to deliver health gains through improved functional health status.
Understanding how much mortality or disease burden is avertable based on providing access to high-quality personal health care and modifying behavioural and environmental risks through public health initiatives is of high policy interest. GBD currently assesses mortality and burden attributable to a large set of risk factors, which supplies useful insights on the potential of risk modification to improve health. Quantification of the full potential of personal health care to reduce burden by cause would provide an important additional piece of policy-relevant information. Controlling for other factors through statistical modelling, such as income and educational attainment, we could examine how much cause-specific variation relates to the HAQ Index. Such work would help to pinpoint opportunities for national and subnational progress through health-system improvements, which would likely include public health programmes and policies as well as the organisation and delivery of personal health services across levels of care.”
Life expectancy by state, 1959-2016 (from the article’s appendix)
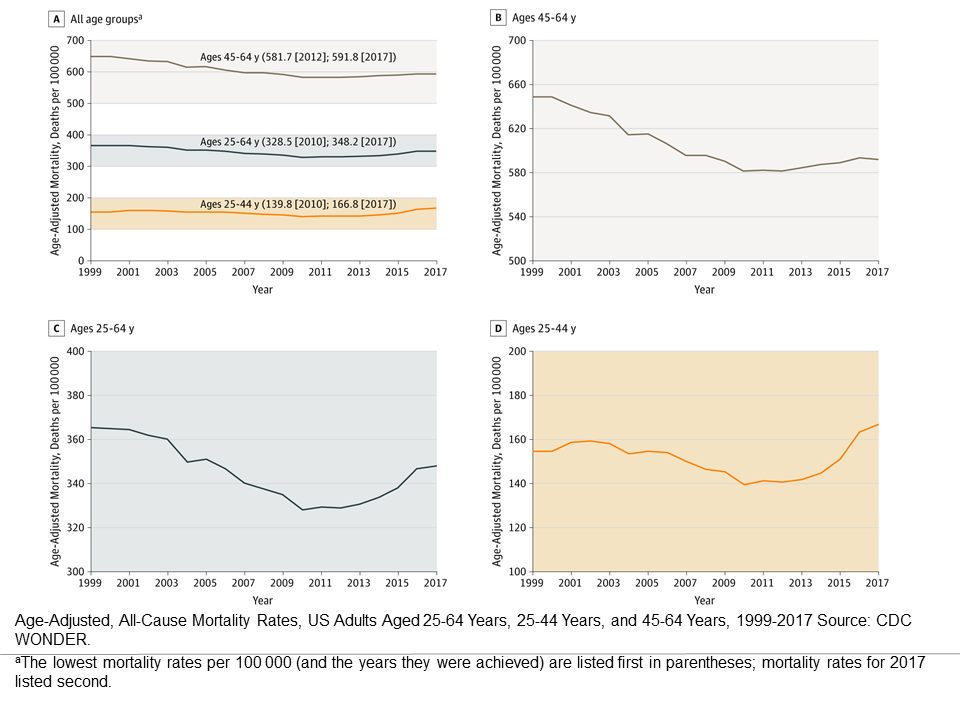
State mortality trends, ages 25-64, 1999-2017 (from the article’s appendix)
Life Expectancy and Mortality Rates in the United States, 1959-2017 (2019.11.27)
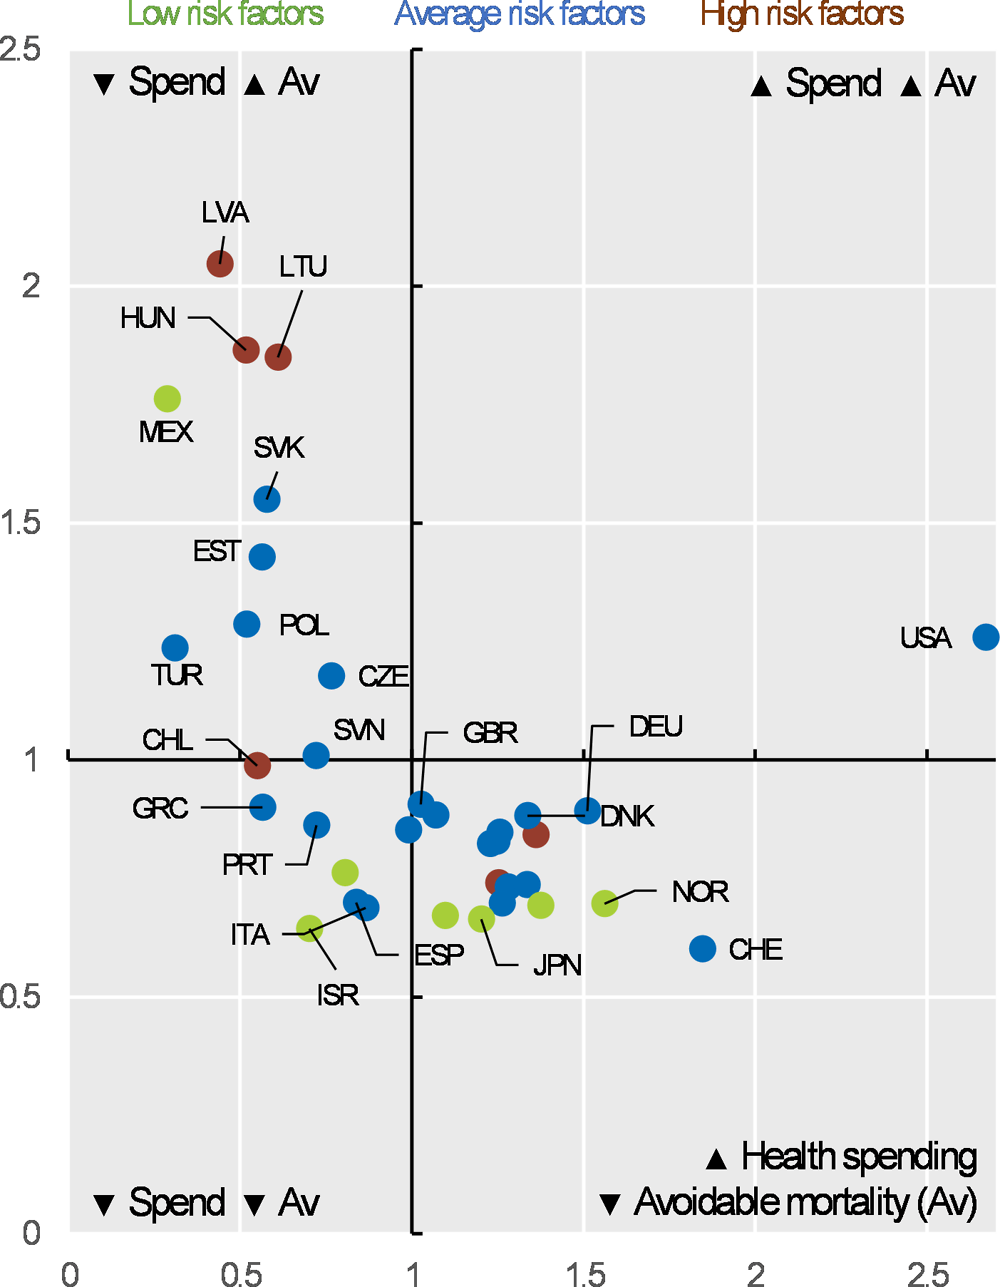
Avoidable mortality (preventable and treatable) and health expenditure
Health at a Glance 2019: OECD Indicators
“Description of System: Mortality data for U.S. residents from the National Vital Statistics System were used to calculate potentially excess deaths from the five leading causes of death among persons aged <80 years. CDC’s NCHS urban-rural classification scheme for counties was used to categorize the deaths according to the urban-rural county classification level of the decedent’s county of residence (1: large central metropolitan [most urban], 2: large fringe metropolitan, 3: medium metropolitan, 4: small metropolitan, 5: micropolitan, and 6: noncore [most rural]). Potentially excess deaths were defined as deaths among persons aged <80 years that exceeded the number expected if the death rates for each cause in all states were equivalent to those in the benchmark states (i.e., the three states with the lowest rates). Potentially excess deaths were calculated separately for the six urban-rural county categories nationally, the 10 U.S. Department of Health and Human Services public health regions, and the 50 states and District of Columbia.
Results: The number of potentially excess deaths among persons aged <80 years in the United States increased during 2010–2017 for unintentional injuries (APC [annual percent change]: 11.2%), decreased for cancer (APC: −9.1%), and remained stable for heart disease (APC: 1.1%), chronic lower respiratory disease (CLRD) (APC: 1.7%), and stroke (APC: 0.3%). Across the United States, percentages of potentially excess deaths from the five leading causes were higher in nonmetropolitan counties in all years during 2010–2017. When assessed by the six urban-rural county classifications, percentages of potentially excess deaths in the most rural counties (noncore) were consistently higher than in the most urban counties (large central metropolitan) for the study period. [..] Potentially excess deaths from cancer decreased in all county categories, with the largest decreases in large central metropolitan (APC: −16.1%) and large fringe metropolitan (APC: −15.1%) counties.”
Percentage of deaths that were potentially excess among persons aged <80 years from the five leading causes of death — National Vital Statistics System, United States, 2010–2017 [Potentially excess deaths are defined as deaths among persons aged <80 years in excess of the number that would be expected if the death rates for each cause in all states were equivalent to those in the benchmark states (i.e., the three states with the lowest rates).]
Percentage of deaths that were potentially excess among persons aged <80 years from the five leading causes of death, by urban-rural county classification — National Vital Statistics System, United States, 2017
Potentially Excess Deaths from the Five Leading Causes of Death in Metropolitan and Nonmetropolitan Counties — United States, 2010–2017 (2019.11.8)
“In 2017, there were 24.5 million incident cancer cases worldwide (16.8 million without nonmelanoma skin cancer [NMSC]) and 9.6 million cancer deaths. The majority of cancer DALYs came from years of life lost (97%), and only 3% came from years lived with disability. The odds of developing cancer were the lowest in the low SDI [socio-demographic index] quintile (1 in 7) and the highest in the high SDI quintile (1 in 2) for both sexes. [..] The most common causes of cancer deaths and DALYs for men were TBL [tracheal, bronchus and lung] cancer (1.3 million deaths and 28.4 million DALYs), liver cancer (572 000 deaths and 15.2 million DALYs), and stomach cancer (542 000 deaths and 12.2 million DALYs). [..] The leading causes of cancer deaths and DALYs for women were breast cancer (601 000 deaths and 17.4 million DALYs), TBL cancer (596 000 deaths and 12.6 million DALYs), and colorectal cancer (414 000 deaths and 8.3 million DALYs).

[..] Our analysis shows how cancer has increased in importance as a global health problem. Although it ranked sixth in 1990 among the top causes for DALYs worldwide, it has risen to the second place in 2017 behind cardiovascular diseases. Cancer now occupies the second place in the ranking of global deaths, YLLs, and DALYs, and is among the top 2 leading causes of deaths, YLLs, and DALYs in the highest 3 SDI quintiles. This shift in disease burden owing to the demographic and epidemiological transitions has important implications on health policy: ensuring access to universal health coverage and protection against catastrophic health expenditure directly related to the cancer treatment, but also against the long-term costs associated with a cancer diagnosis for a household, has to be prioritized. Fifty percent of cancer cases occur in high SDI countries, but only 30% of cancer deaths, 25% of cancer DALYs, and 23% of cancer YLLs. To ensure sustainable global development, increased efforts are needed to reduce these health inequalities. Recognizing the strong interdependencies between socioeconomic status and health and the large contribution of cancer to the overall disease burden is a first step in making investments in cancer prevention and treatment a priority. Cervical cancer is likely the best example of inequalities in cancer with vast differences in burden by SDI. As a completely preventable cancer where cost-effective vaccination and screening approaches are available, cervical cancer has recently gained global attention through the World Health Organization’s call for elimination. Falling incidence rates in all SDI quintiles are encouraging, but countries with the least resources are still facing the largest burden because of lack of screening programs. Immunization against human papillomavirus, screening, and treatment of cervical cancer is therefore of utmost importance in all socioeconomic settings.”
“In 2017, suicide and homicide were the second and third leading causes of death for persons aged 15–19 and 20–24 and ranked second and fifth among persons aged 10–14. [..] suicide and homicide death rates for persons aged 10–24 increased recently during the time period, since 2007 for suicide, and since 2014 for homicide. For persons aged 10–14, suicide rates began increasing in 2010, whereas the homicide rate declined during the 2000–2017 period. In contrast, recent increases were observed for both suicide and homicide death rates among persons aged 15–19 and 20–24, with the increases for suicide rates beginning earlier than for homicide rates. In addition, for persons aged 15–19 and 20–24, suicide rates surpassed homicide rates during the latter part of the period.”
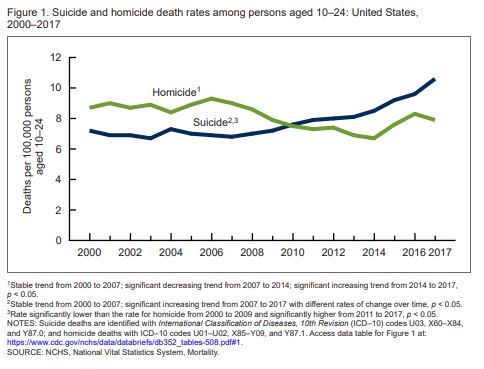
Death Rates Due to Suicide and Homicide Among Persons Aged 10–24: United States, 2000–2017 (October 2019)