“The End-Stage Renal Disease (ESRD) Treatment Choices (ETC) Model is an innovative payment model that aims to test whether greater use of home dialysis and kidney transplantation for Medicare beneficiaries with ESRD will reduce Medicare expenditures, while preserving or enhancing the quality of care furnished to beneficiaries with ESRD.
[..] The ETC Model is expected to achieve these goals by adjusting certain payments to nephrologists and other clinicians managing beneficiaries with ESRD (Managing Clinicians) and ESRD facilities selected to participate in the Model. In particular, the Model will apply payment adjustments to the adjusted ESRD Prospective Payment System (PPS) per treatment base rate under the ESRD PPS to ESRD facilities required to participate, as well as the monthly capitation payment (MCP) to Managing Clinicians required to participate. These payment adjustments will offer the incentive to participating ESRD facilities and Managing Clinicians to work with beneficiaries and caregivers in the choice of treatment modality, and to provide additional resources to support greater utilization of home dialysis and kidney transplantation.
[..] The payment adjustments for those ESRD facilities and Managing Clinicians selected for participation in the ETC Model will apply to select Medicare claims with dates from January 1, 2021 through June 30, 2027.”
[from the CMS Innovation website:]
“CMS is requiring participation in order to minimize the potential for selection effect. Selection effect occurs when only the potential participants who would benefit financially from a model choose to participate. Selection effect may reduce the amount of savings that a model can generate. Requiring participation for certain models helps CMS understand the impact on a variety of provider types so that the resulting data would be more broadly representative.
CMS will select ESRD facilities and Managing Clinicians to participate in the model according to their location in randomly selected geographic areas so as to account for approximately 30 percent of the ESRD facilities and Managing Clinicians in the 50 States and District of Columbia.”
End-Stage Renal Disease Treatment Choices (ETC) Model Fact Sheet, CMS.gov, 2020.9.18
“The aim of this model is to test whether bundled, prospective, site neutral, modality agnostic, episode-based payments to physician group practices (PGPs), hospital outpatient departments (HOPD), and freestanding radiation therapy centers for radiotherapy (RT) episodes of care reduces Medicare expenditures, while preserving or enhancing the quality of care for Medicare beneficiaries. The RO Model has a five-year Model performance period that begins on January 1, 2021 and runs through December 31, 2025.
[..] meaning that half of the episode payment amount is paid when the RO episode is initiated, and the second half is paid when the episode ends. Episode payments are split into a professional component (PC) payment, which is meant to represent payment for the included RT services that may only be furnished by a physician, and the technical component (TC) payment, which is meant to represent payment for the included RT services that are not furnished by a physician, including the provision of equipment, supplies, personnel, and costs related to RT services.”
[from the CMS Innovation website:]
The RO Model includes four quality measures, starting in PY1.
- Oncology: Medical and Radiation – Plan of Care for Pain -NQF #0383; CMS Quality ID #144
- Treatment Summary Communication – Radiation Oncology
- Preventive Care and Screening: Screening for Depression and Follow-Up Plan -NQF #0418; CMS Quality ID #134
- Advance Care Plan -NQF #0326; CMS Quality ID #047
Radiation Oncology Model Fact Sheet, CMS.gov 2020.9.18
| Cumulative Impact in PY1 and PY2 (2016-2017) | Impact in PY2 (2017) | ||||
|---|---|---|---|---|---|
| Model-wide | 2016 Cohort | Model-wide | 2016 Cohort | 2017 Cohort | |
| Number of beneficiaries | 1,709,394 | 954,605 | 1,232,215 | 477,426 | 754,789 |
| Estimated Gross Impact (difference-in-differences estimate) Per Beneficiary Per Year (95% confidence interval) | -$72.06 (-139.29, -4.82) | -$38.60 (-127.52, 50.31) | -$50.16 (-127.89, 27.57) | $51.35 (-66.56, 169.27) | -$114.37 (-217.04, -11.70) |
| Percentage impact | -0.57 | -0.32 | -0.40 | 0.43 | -0.87 |
| Estimated Net Impact after Shared Savings Paid Out (difference-in-differences estimate) Per Beneficiary Per Year (95% confidence interval) | $54.40 (-12.84, 121.64) | $98.40 (9.49, 187.32) | $93.80 (16.07, 171.54) | $244.08 (126.16, 320.72) | -$1.25 (-103.92, 101.42) |
| Percentage impact | 0.42 | 0.79 | 0.72 | 1.97 | -0.01 |
| Cumulative impact in both years | Impact in PY2 (2017) | ||||
|---|---|---|---|---|---|
| Outcome | Model-wide impact (%) | 2016 cohort (%) | Model-wide impact (%) | 2016 cohort (%) | 2017 cohort (%) |
| Acute care hospital | -15.9 (-.39) | -17.43 (-0.44) | -11.23 (-0.28) | -6.88 (-0.18) | -13.98 (-0.33) |
| Skilled nursing facility | -7.63 (-0.74) | -17.62 (-1.715) | -8.07 (-0.79) | -28.75 (-2.96) | 5.01 (0.48) |
| Other post-acute care facility | -15.17 (-3.48) | -10.57 (-2.27) | -14.76 (-3.58) | -4.93 (-1.13) | -20.98 (-5.27) |
| Outpatient facility | UNK | UNK | -22.75 (-0.99) | 12.83 (0.56) | -45.26 (-1.97) |
| Professional services | -0.8 (-0.03) | 5.07 (0.17) | -7.49 (-0.25) | -6.32 (-0.22) | -8.23 (-0.26) |
| Home health | UNK | UNK | UNK | UNK | -1.51 (-0.19) |
| Durable medical equipment | UNK | 5.07 (2.01) | UNK | 7.21 (3.12) | UNK |
The model showed a small, but statistically significant reduction in skilled nursing facility stays and a marked increase in annual wellness visits (there was also a decrease in E&M visits in the 2017 cohort). There were no significant differences in beneficiaries with ambulatory care sensitive condition hospitalizations, beneficiaries with unplanned 30-day readmissions or hospital readmissions from a skilled nursing facility. UNK = unknown.
Second Evaluation Report: Next Generation Accountable Care Organization Model Evaluation, NORC, January 2020
“Patients experienced hospital-acquired conditions at the rate of 133.4 per 1,000 discharges in the pre-HACRP [Hospital-Acquired Condition Reduction Program] period (95% CI: 126.6, 140.1) and 122.2 per 1,000 discharges in the post period (95% CI: 116.8, 127.6). While there were no significant changes in the rates of hospital-acquired conditions during the pre period, the adjusted annual slope changed by −6.2 per 1,000 discharges annually (95% CI: −9.2, −3.3) in the post period. The policy was not associated with a significant change in the adjusted annual slope of hospital-acquired conditions (−4.3; 95% CI: −11.4, 2.8).
[Discussion] In this evaluation of the Hospital-Acquired Condition Reduction Program using clinical registry data from Michigan hospitals that participated in a statewide surgical quality collaborative, we reported three main findings. First, the rates of hospital-acquired conditions reported in our study—based on high-quality data from an all-payer statewide clinical registry—were much higher than the rates of those conditions that were used to evaluate hospital performance in the HACRP. Second, there were overall trends toward fewer hospital-acquired conditions throughout the study period. Third, the HACRP was not associated with an independent decrease in conditions targeted by the program.
[Policy Implications] While thirty-day readmissions are easy to measure using claims data, the reliable and valid measurement of hospital-acquired conditions is a major challenge. CMS uses a claims-based algorithm to derive a portion (domain 1 of the HACRP) of hospitals’ hospital-acquired condition scores. There is evidence that these data may be unreliable and underestimate the true incidence of certain conditions. Even data derived from the CDC’s National Healthcare Safety Network surveillance system data (the same data used for domain 2 of the HACRP) estimated the incidence of certain hospital-acquired conditions at an order of magnitude less than we reported, based on high-quality data from a surgical registry. Yet our documented rates of hospital-acquired conditions are far more similar to those from other high-quality surveillance systems, such as the Medicare Patient Safety Monitoring System. This suggests that national strategies to collect hospital-acquired condition data used for the HACRP are either unreliable or subject to bias from hospitals that may be reluctant to report events that result in financial penalties.”
“Largely overlooked in the literature, however, is the fact that the decline in readmission rates roughly coincided with a period of declining admission rates. In general, readmission rates should fall as admission rates fall because the probability of an admission occurring soon after another is lower when there are fewer admissions per patient. We examined this relationship by conducting a simulation in which we removed random samples of admissions from Medicare claims data and recalculated readmission rates.
Simulated 30-day hospital readmission rates under assumptions that readmissions are or are not caused by care in a prior admission, and observed adjusted rates, 2009–14
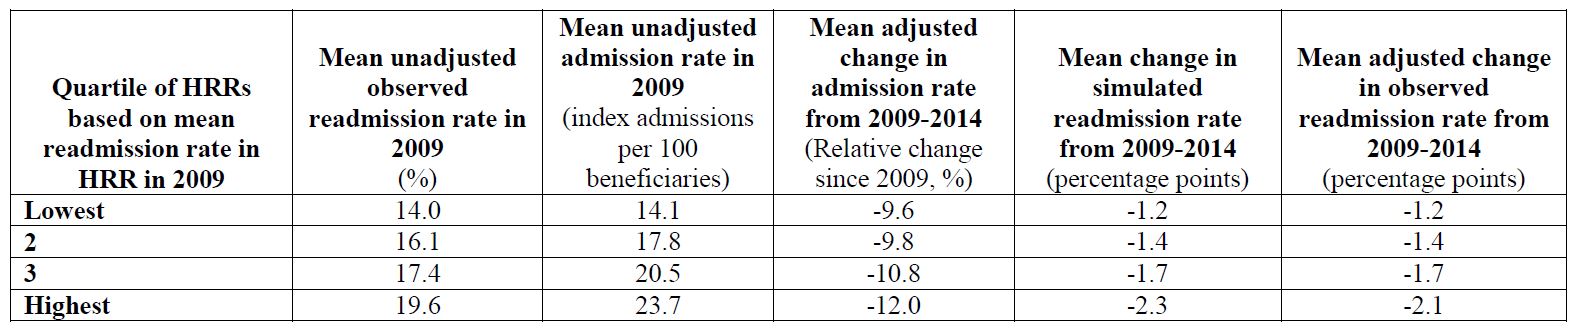
Simulated and observed changes in readmission rates among HRRs [hospital referral regions] with higher vs. lower initial readmission rates in 2009 Means for each quartile of HRRs are weighted means, with each HRR’s contribution weighted by its number of index admissions in 2009 (for mean readmission rates) or by its number of beneficiaries in the study sample (for mean admission rates). Unweighted means produced similar conclusions. This analysis includes the largest 250 HRRs. Results were very similar in analyses of the largest 200, 150, 100, or 50 HRRs that would be less sensitive to mean reversion causing greater reductions in admissions and readmissions in HRRs with higher baseline rates. Thus, our results suggest that areas with higher readmission rates at baseline also had higher admission rates at baseline and experienced greater reductions in readmission rates from 2009-2014 because of greater reductions in admission rates.
[..] Multiple lines of evidence suggest that the decrease in admissions was unrelated to the HRRP [Hospital Readmissions Reduction Program]. In particular, admission rates fell substantially across all payers. All else being equal, we would not expect hospitals to respond to the HRRP by broadly reducing admissions because the associated revenue losses would more than offset the avoided penalties. In addition, the decline in admissions occurred during a national slowdown in health care spending growth, started before implementation of the HRRP and other value-based payment initiatives, and accelerated with the implementation of the Recovery Audit Contractor Program to limit unnecessary short stays—which suggests contributions from multiple factors.”
Did Hospital Readmissions Fall Because Per Capita Admission Rates Fell?
“Congress excluded from its PPS [prospective payment system] legislation 40 “chronic care hospitals” whose average length of stay exceeded 25 days. Concerned that these few institutions might not survive, Congress continued to reimburse them on the basis of their average per diem costs, the payment system whose bloat had prompted the new law. This legislative “carve-out” became the preexisting condition exploited by entrepreneurs to create the LTACH [long-term acute care hospital] industry, today about 400 hospitals whose accreditation requires a 25-day mean length of stay. Mostly for-profit institutions geographically concentrated in the southern United States, LTACHs care primarily for patients who otherwise would be admitted to skilled nursing facilities (SNFs), but their reimbursement from Medicare is triple the SNF per diem rate. Not surprisingly, LTACHs do very well, their profit margins in the double digits. Less clear is whether they do any good. Despite their high marginal cost, recent analyses suggest that LTACHs provide no measurable benefit to patients.
These findings don’t mean that the Centers for Medicare and Medicaid Services has been asleep at the wheel. Indeed, Medicare has refined its regulations repeatedly to restrain “gaming” by LTACHs, including creation of a PPS for LTACHs that penalizes them for discharging patients prematurely; the “25% rule,” intended to limit the proportion of admissions to an LTACH from any one acute care hospital; the “ping-pong” rule, which forbids bouncing patients back and forth between acute care hospitals and LTACHs; two 3-year moratoriums, enacted in 2007 and 2014, on building new LTACHs (or increasing the number of beds); and, most recently, the “3-day rule,” which restricts LTACH admissions to patients who have been in an acute care hospital ICU for at least 3 days.
But these regulatory reforms have been reactive, not preemptive. Inevitably, as Einav and colleagues note, Medicare’s dogged efforts to constrain LTACH profiteering will only “generate new, unintended opportunities for [LTACHs]…and the game of whack-a-mole will continue.” But there’s nothing illegal about the LTACH game. Like all players in the U.S. health care system, LTACHs “respond to the incentives and opportunities a market allows. That’s what they’re supposed to do.”
Not incidentally, physicians’ decisions about patients’ posthospital care now account for about 20% of all Medicare spending but for more than 70% of its geographic variation. Why? “Simply put, we have insufficient understanding about which post-acute care setting…benefits which types of patient.” Doc marvels at proposed solutions to this problem: “cross-continuum case-management interventions…communication protocols for providers across settings…interoperable health information technologies and focused investments in…telemedicine.” Sounds complicated, Doc says, recalling the days when he followed his patients in nursing homes after caring for them in the hospital, none of their preexisting conditions lost in translation. I was their doctor, you know? He harbors no illusion that this simpler, better way will survive in a culture where now “every piece of good work [in medicine] needs a promising business model.” Doc hopes Medicare-for-all (or for-more) can disrupt this devolution, but stories like Michelle’s give him pause — so many devils in the details.
Preexisting Conditions (2019.10.17)
Reform 7: Single-payer with ACA essential benefits and sliding-scale cost-sharing requirements. Under this policy, all legally present US residents are deemed enrolled in a single health insurance plan developed and regulated by the federal government (excluding undocumented immigrants). The plan does not charge premiums but has a sliding-scale cost-sharing schedule based upon income. The base actuarial value for the plan is 80 percent, with people with incomes below 400 percent of FPL eligible for higher actuarial value coverage, consistent with the schedule described above. As they do today in the Marketplaces, under this reform, individuals and families would apply for reduced cost sharing every year. Those not explicitly enrolling in the national plan are enrolled by health care providers when they seek medical care. Covered benefits are consistent with the essential health benefits covered in the ACA Marketplaces. No private insurer can offer health insurance coverage. Payment rates for all services are set at current Medicare rates, except for hospital services, which are set at 115 percent of Medicare rates.”

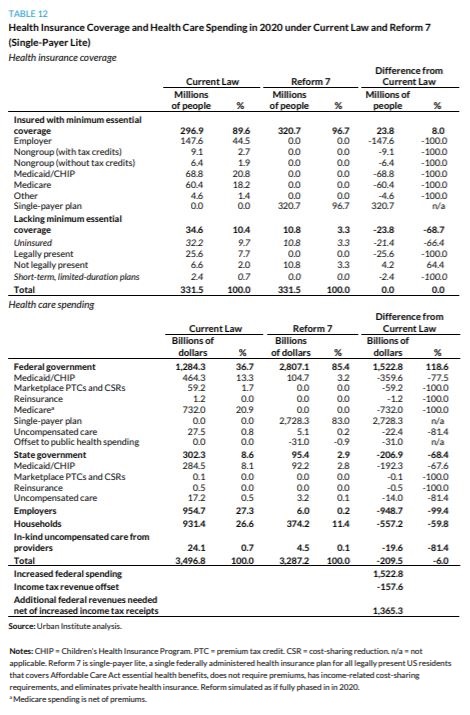
“Simulation of Reform 7 Compared with Current Law Single-payer lite program covering ACA essential health benefits and income-related cost sharing, enrolling all legally present US residents, prohibiting private health insurance coverage, and retaining current law Medicaid program for LTSS Coverage. [..] the single-payer lite approach insures all legally present US residents, thereby increasing the number of people with minimum essential coverage by 23.8 million and reducing the number with no insurance coverage at all by 21.4 million. Though 25.6 million uninsured people legally residing in the US gain insurance coverage under reform 7, 4.2 million undocumented immigrants lose health insurance, lowering the net coverage effect of the reform. This increase in uninsurance for this population occurs because the reform eliminates private health insurance, but the new public program does not cover those not legally present in the US. Therefore, 4.2 million people with private insurance under current law (employerbased or nongroup) no longer have insurance coverage, bringing the total number of uninsured people to 10.8 million, all of whom are undocumented immigrants. Theoretically, under an alternative specification, private insurance could be offered to the population not legally present, allowing them to purchase insurance with their own funds. However, because only the undocumented population would have reason to purchase such coverage, potential consumers may fear the government consequences of doing so (e.g., deportation). Additional subsidization of providers serving disproportionate shares of undocumented immigrants would likely be an effective approach. We do not estimate such costs here, beyond acknowledging that federal and state governments and providers continue to fund some uncompensated care.
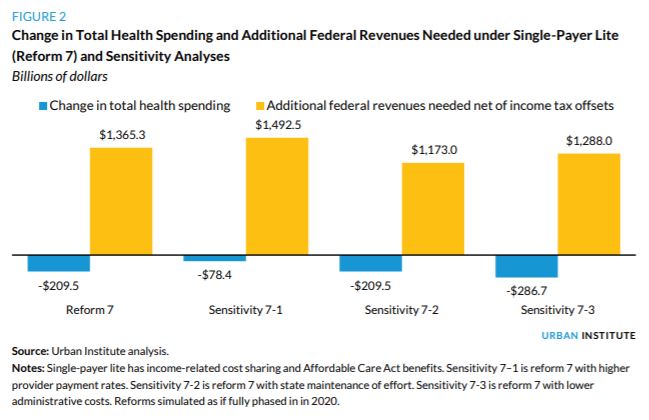
Health care spending. We offset a portion of federal government spending for reform 7 to account for the single-payer benefits provided to people receiving benefits from Veterans Affairs, the Department of Defense, and Indian Health Services under current law ($31.0 billion). Accounting for those offsets, the elimination of acute-care spending under Medicaid/CHIP (LTSS is still covered by Medicaid as under current law), Marketplace subsidies, reinsurance, and Medicare, net federal government health care spending increases by $1.5 trillion under reform 7. With the elimination of employer-based insurance (reducing employer health care spending by $948.7 billion), taxable income increases, thereby increasing income tax revenues by $157.6 billion, requiring an additional $1.4 trillion in new federal revenues to finance the reform. National health spending falls by $209.5 billion, or 6.0 percent, reflecting that administrative savings and savings from lower provider payment rates outweigh the increased costs associated with near-universal coverage and reduced income-related cost-sharing requirements.
State government health care spending decreases by $206.9 billion, accounting for the elimination of Medicaid/CHIP acute-care programs and savings resulting from reduced spending on uncompensated care. Household spending on premiums and out-of-pocket costs decreases by $557.2 billion. Premium spending is eliminated, but out-of-pocket costs, which would be income related for those covered by the new program, would continue. And total out-of-pocket spending for those not legally present and becoming newly uninsured increases. Household spending on LTSS and other uncovered services continues as well.”
From Incremental to Comprehensive Health Insurance Reform: How Various Reform Options Compare on Coverage and Costs (October 2019)
“MSSP ACOs continue to achieve higher savings the longer they participate in the program. The MSSP is Medicare’s largest alternative payment model and seeks to transition Medicare away from fee-for-service payment into a new value-based environment. In 2018, 548 MSSP ACOs provided care to over 10 million Medicare beneficiaries and reduced Medicare spending by $739M. [..]
Avalere’s analysis found that the low-revenue, physician-led ACOs performed significantly better than the high-revenue, hospital-led ACOs. On average, physician-led ACOs produced almost 7 times the amount of Medicare savings per beneficiary than hospital-led ACOs (Figure 1).

Avalere’s analysis also finds that ACOs in their first performance year increased Medicare spending, while all other ACOs reduced spending in 2018. The highest-performing ACOs were those with the most experience (Figure 2).”
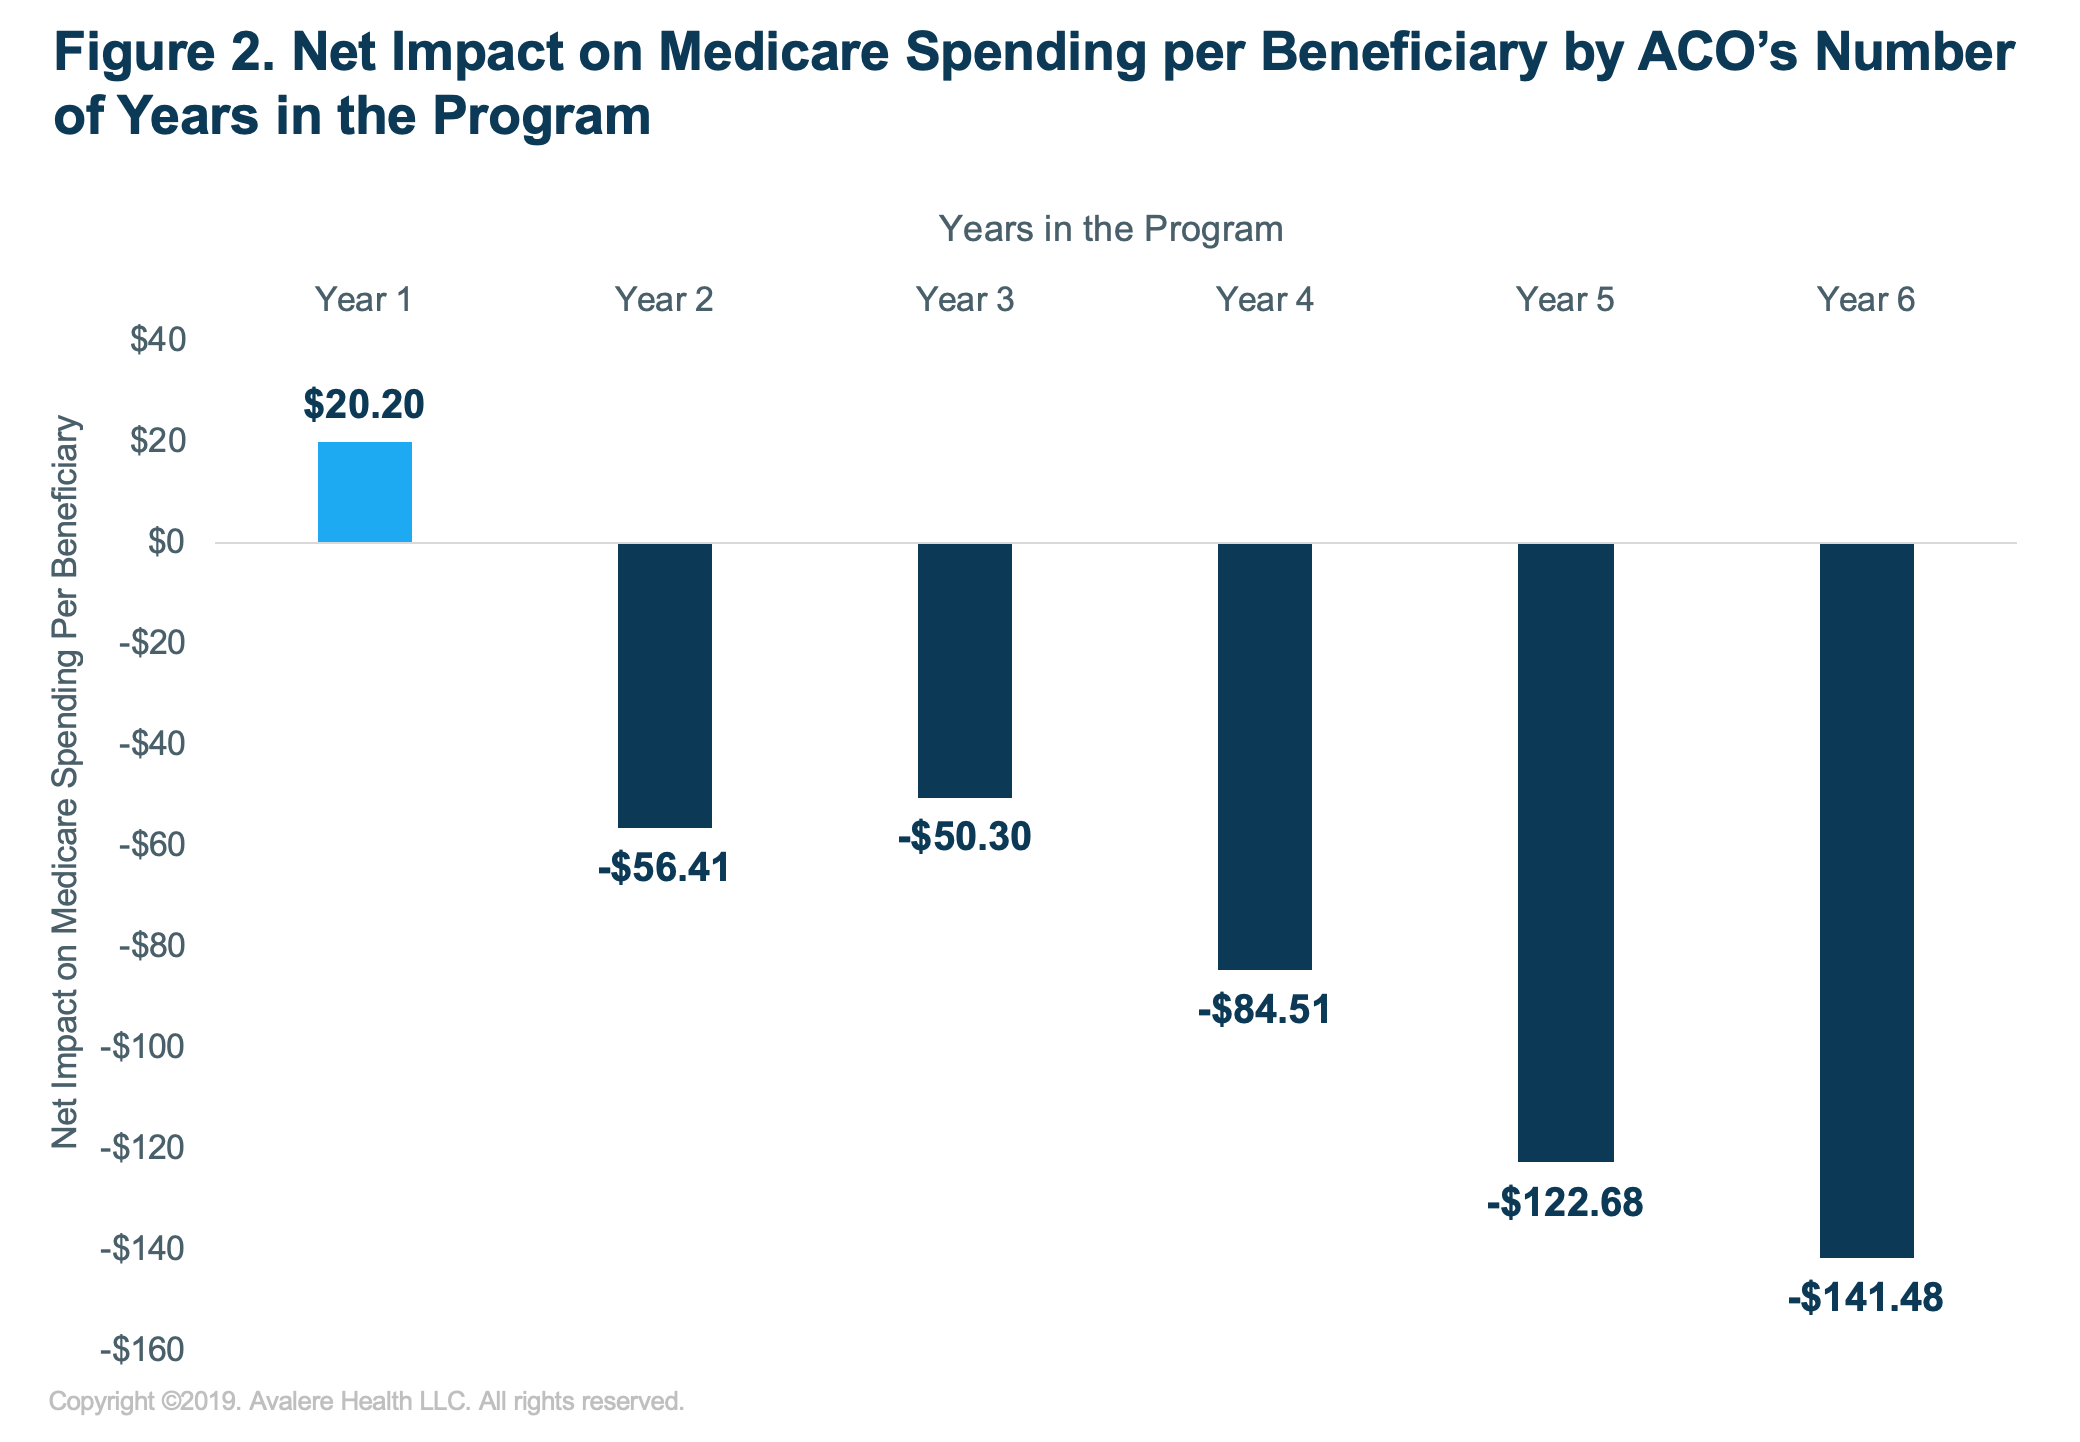
Physician-Led Accountable Care Organizations Outperform Hospital-Led Counterparts (2019.10.15)
“The Medicare Part D standard benefit has different phases where enrollees, Part D plan sponsors, drug manufacturers, and Medicare pay varying shares of total drug costs. These phases include a deductible, an initial coverage phase, a coverage gap phase (once known as the “doughnut hole”), and catastrophic coverage. The allocation of costs in each benefit phase was spelled out in the Medicare Modernization Act of 2003 (the law establishing the Part D program), and has been modified through subsequent legislation.
- In the deductible phase, Part D enrollees who do not receive low-income subsidies (LIS) pay 100% of their drug costs.
- After the deductible, in the initial coverage phase, enrollees pay 25% and Part D plans pay 75%.
- After reaching the initial coverage limit but before reaching the catastrophic threshold:
- For brand-name drugs, enrollees pay 25% of drug costs, plans pay 5%, and drug manufacturers provide a 70% price discount.
- For generic drugs, enrollees pay 37% of drug costs and plans pay 63% in 2019.
- When enrollees’ annual out-of-pocket spending—including what they pay directly and the value of the manufacturer discount on brand-name drugs in the coverage gap—exceeds the catastrophic coverage threshold, they pay 5% of their total drug costs, plans pay 15%, and Medicare pays 80%.
[..] In 2020, Medicare Part D enrollees are facing a relatively large increase in out-of-pocket drug costs before they qualify for catastrophic coverage. This is due to the expiration of the ACA provision that constrained the growth in out-of-pocket costs for Part D enrollees by slowing the growth rate in the catastrophic threshold between 2014 and 2019; in 2020 and beyond, the threshold will revert to the level that it would have been using the pre-ACA growth rate calculation. For 2020, the out-of-pocket spending threshold will increase by $1,250, from $5,100 to $6,350. [..]
While there are no precise estimates of the number of Part D enrollees who will be affected by the increase in the out-of-pocket threshold for 2020, the increase will directly affect Part D enrollees with very high out-of-pocket drug costs. In 2017 (the most current year of Part D claims data available), 4.9 million non-LIS enrollees reached the coverage gap phase; of that total, 1 million non-LIS enrollees had out-of-pocket drug costs that exceeded the catastrophic threshold. Had the threshold been higher in 2017, fewer than 1 million enrollees would have qualified for catastrophic coverage that year. This means that a larger number of enrollees would have remained in the coverage gap in 2017, where they pay a larger share of their total costs than in the catastrophic phase.”
How Will The Medicare Part D Benefit Change Under Current Law and Leading Proposals? (2019.10.11)