“Current US guidelines recommend absolute risk estimation of cardiovascular disease (CVD) to guide decisions on preventive therapies, but communicating absolute risk alone can be challenging for patients and clinicians. In 2021, the European Society of Cardiology guidelines added a recommendation to calculate risk age along with absolute risk to improve communication. Risk age represents the age of a hypothetical person with the same predicted absolute risk but optimal risk factor levels. This may help individuals understand how their risk compares with chronological age (is my risk age older than my actual chronological age?) and may motivate adherence to lifestyle modifications or guideline-recommended preventive care based on absolute risk. While risk age was previously developed for the Framingham CVD risk model, this has not been updated for the Predicting Risk of Cardiovascular Disease Events (PREVENT) equations. Therefore, we developed PREVENT risk age equations and describe its distribution in the US population. [..]
The optimal profile was defined as a non–high-density lipoprotein cholesterol level of 120 mg/dL (to convert to millimoles per liter, multiply by 0.0259), systolic blood pressure of 110 mm Hg, estimated glomerular filtration rate of 90 mL/min/1.73 m2, no diabetes, nonsmoking, and not receiving statin or antihypertensive therapy as defined by the American Heart Association/American College of Cardiology online calculator. [..]
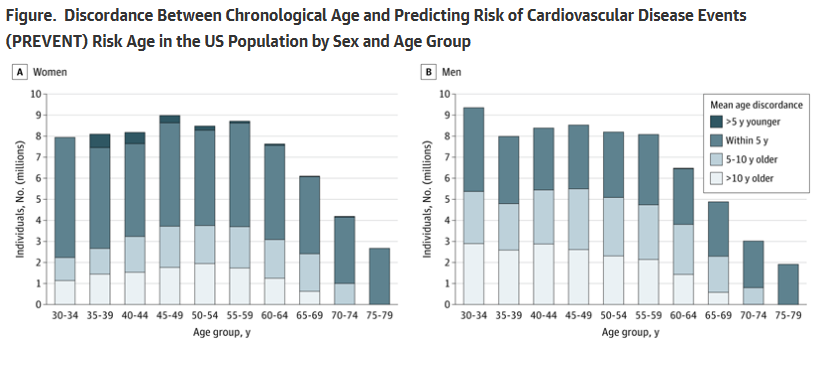
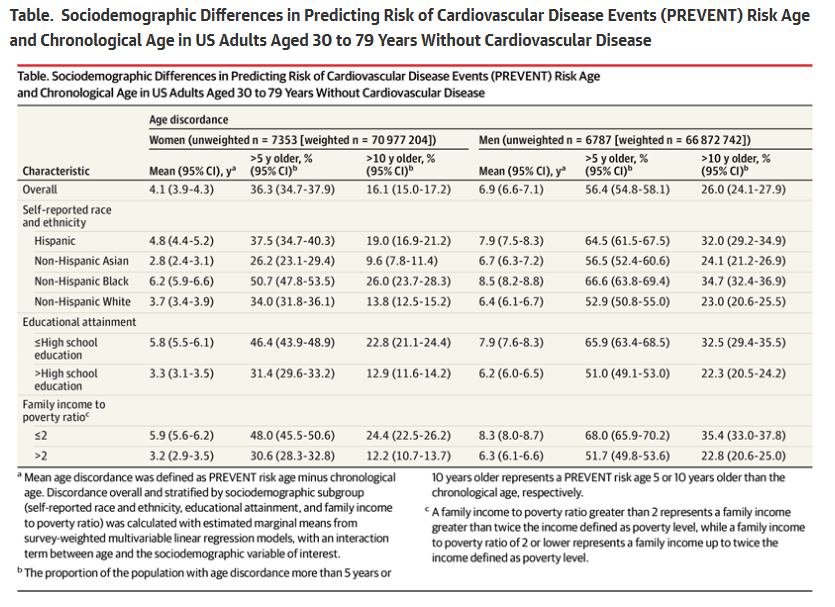
The eligible sample included 14 140 participants representing approximately 138 million US adults. The mean PREVENT risk age and chronological age were 55.4 (95% CI, 54.9-55.9) and 51.3 (95% CI, 50.9-51.8) years, respectively, in women and 56.7 (95% CI, 56.2-57.2) and 49.7 (95% CI, 49.2-50.2) years, respectively, in men. Discordance varied by sociodemographic factors, with greater discordance among middle-aged adults, racial and ethnic minoritized groups, those with a worse income to poverty ratio, or lower educational attainment (Figure and Table). Specifically, 22.8% of women and 32.5% of men with a high school education or less had a PREVENT risk age more than 10 years older than their chronological age. Last, we developed an accompanying online tool to communicate PREVENT risk age and absolute PREVENT risk (https://nwkhanlab.shinyapps.io/riskage/).
[..] PREVENT risk age and absolute risk together may offer an intuitive approach for communicating CVD risk, can be automated into electronic health records, and could help clinicians and patients in shared decision-making for preventive therapies. This builds on growing enthusiasm for assessing biomarkers to estimate biological aging. PREVENT risk age also uniquely identifies younger adults who, despite low absolute risk, are at higher relative risk due to suboptimal risk factor levels. The present findings demonstrate the feasibility of calculating PREVENT risk age and extend prior studies reporting the distribution of absolute CVD risk determined with PREVENT equations in the US population.5 One limitation is that the definition of optimal risk may influence the calculation of PREVENT risk age. Alternatively, population-based percentiles of risk can provide a complementary approach to communicate risk, but these are influenced by suboptimal population health. Prospective studies are needed to assess the acceptability and impact of communicating risk age on motivation for lifestyle changes, adherence to preventive therapies, and patient outcomes.”
Full article, V Krishnan, X Huang, AM Perak et al. JAMA Cardiology, 2025.7.30
Older Than You Think—The Psychology of Comparison
“the authors’ use of the PREVENT risk age metric illustrates how conventional clinical risk estimation can be repackaged in a psychologically resonant way. Just as Festinger posited that individuals are motivated when they perceive themselves falling behind a relevant peer group, so too might a 50-year-old individual be galvanized into action on learning their biological age is closer to 65 years. This strategy taps into an intuitive grasp of time and aging, a concept more emotionally salient than a probabilistic 10-year risk estimate, and may help bridge the persistent gap between knowledge of risk and engagement in health-promoting behavior.
Notably, the discordance between chronological and risk age was greatest among adults aged 40 to 64 years, with no discordance observed among individuals aged 75 to 79 years. The lack of discordance in the oldest group may reflect a survivor bias in the NHANES database or a ceiling effect of risk algorithms, which tend to compress risk estimates at older ages. Given that life expectancy for the total US population was 77.5 years in 2022, it certainly appears that older adults who participate in NHANES may be healthier than their peers.
[..] As Krishnan and colleagues acknowledge, had they chosen a different reference profile, the magnitude of discordance might have changed. Additionally, what constitutes an optimal risk profile may vary by sex and age; for example, older adults may have risk contributions that vary from traditional risk factors and may have important competing risk considerations. Nevertheless, any reference profile would have entailed similar tradeoffs, as no universally agreed-on age- and sex-specific optimal benchmarks exist. [..]
By translating cardiovascular risk into an age-based metric, tools like PREVENT risk age offer patients a more personally meaningful reflection of their health. When individuals see that their heart is aging faster than their peers’, it can transform abstract probabilities into urgent motivation. Theodore Roosevelt famously warned that comparison is the thief of joy; in the realm of cardiovascular prevention, it may also be a powerful spark for change.”
Full editorial, MA Mouslmani, AA Damluji and MG Nanna, JAMA Cardiology, 2025.7.30