“Prediabetes is the most prominent risk factor of T2D [type 2 diabetes] with a yearly progression rate of 5–10% and a lifetime progression risk of 74%, and an independent risk factor for vascular diseases, cancer and neurodegenerative diseases. [..]
Weight-loss-induced prediabetes remission (>5% of initial body weight) was explained by improved insulin sensitivity and reduced visceral adipose tissue (VAT) volume. At long-term follow-up, participants reaching weight-loss-induced prediabetes remission had a 73% reduced risk of developing T2D compared to those who only met the weight loss goal (but not prediabetes remission) and also had reduced signs of kidney and small vessel damage, which may be due to reduced glycemic exposure over time as has previously been indicated. A comparable concept to prediabetes remission has successfully been established in people with T2D in the DIRECT trial [open-label, cluster randomized trial of primary care-led weight management for the remission of type 2 diabetes], where substantial weight loss led to a return to nondiabetic glucose levels in up to 85% of participants, although the risk of redeveloping T2D was high. In general, part of weight loss targeted LIs [lifestyle intervention] is physical exercise, which has been linked with reduced inflammation and has been shown to improve insulin sensitivity independently of body weight change. In individuals with T2D, it has also been demonstrated that physical exercise can improve glycemia without a substantial weight loss effect. However, neither DIRECT nor DPP [US Diabetes Prevention Program] reported on the preventive outcomes of patients who did not reduce body weight but achieved remission.
Here, we provide evidence that non-weight-loss-induced remission of prediabetes protects from T2D development for up to 10 years after the LI started, and that it is characterized by increased subcutaneous adipose tissue (SCAT) compared to nonremission, where VAT increases. Moreover, we show that non-weight-loss-induced remission of prediabetes is mediated by an improvement in insulin sensitivity and insulin secretion.
We analyzed data from the ongoing multicenter LI study PLIS that recruited individuals with prediabetes in study centers throughout Germany within the framework of the German Center for Diabetes Research, where participants received the intervention for 12 months and were followed up for up to 9 years with metabolic phenotyping including oral glucose tolerance tests (OGTTs) for glucose metabolism and whole-body magnetic resonance imaging (MRI) for assessment of body fat distribution before and after the intervention and during follow-up. Of the 1,105 individuals originally included in PLIS, 234 (21.2%) did not lose or even gained weight during the year of the intervention. Of these, 51 returned to NGR [prediabetes remission], that is, were designated ‘responders’ (R; 21.8%), while 183 (78.2%) were ‘nonresponders’ (NR). [..] Overall, there were more women in both groups and R tended to have more women than NR (60.1% in NR versus 74.5% in R, P = 0.085). As has previously been reported for prediabetes remission, R were younger (median = 54.4 ± 17.6 years) than NR (59.4 ± 15.5 years, P = 0.013), had lower fasting and 2 h glucose and slightly higher insulin sensitivity. Intervention intensity was not different between groups.
At first, we investigated whether weight trajectories during the 1-year intervention period were different between R and NR. However, BMI increased similarly in both groups (29.6 ± 2.1 kg m−2 to 30.6 ± 2.1 kg m−2 in R versus 30.5 ± 0.8 kg m−2 to 31.3 ± 0.9 kg m−2 in NR, P group over time = 0.24). This was similar for body weight (84.0 ± 6.2 kg to 86.8 ± 6.5 kg in R versus 88.4 ± 2.9 kg to 90.6 ± 2.9 kg in NR, P group over time = 0.45), lean mass (56.2 ± 4.4 kg to 56.2 ± 4.7 kg in R versus 59.6 ± 2.7 kg to 59.5 ± 2.3 kg in NR, P group over time = 0.93) and fat mass (30.7 ± 4.1 kg to 32.5 ± 4.5 kg in R versus 31.7 ± 2.0 kg to 32.5 ± 1.9 kg in NR, P group over time = 0.34). Maximal aerobic capacity did not differ between groups (18 ± 2.2 ml min kg−1 to 17.6 ± 2.5 ml min kg−1 in R versus 18.5 ± 1.6 ml min kg−1 to 18.4 ± 1.9 ml min kg−1 in NR, P group over time = 0.65). Additionally, adherence to dietary advice based on the evaluation of food diaries was not different between groups, similarly neither habitual physical activity (HPA) score nor daily distance walked (in a subgroup) or lean body mass differed between groups during the intervention and during follow-up, respectively.
Taken together, these data show that prediabetes remission without weight loss compared to nonremission was independent of weight trajectories, overall body composition and physical fitness.
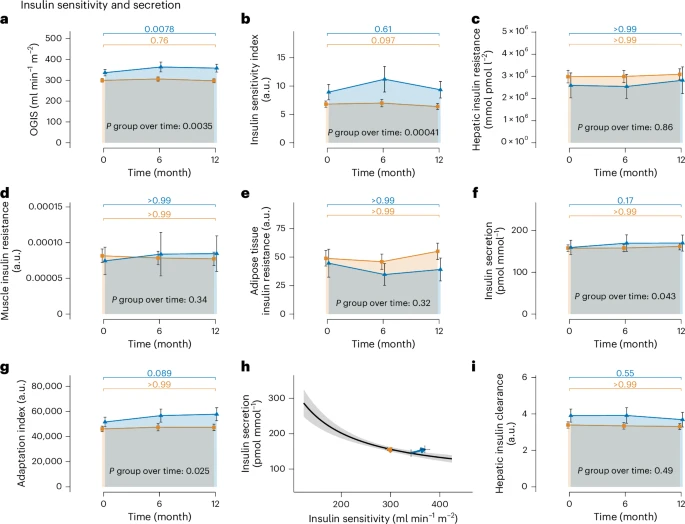
[..] insulin secretion and β-cell function increased in R but not in NR. The C-peptide area under the curve (AUC)0–30 min/glucose AUC0–30 min, an index of insulin secretion, increased from 159.5 ± 17.13 pmol mmol−1 to 169.96 ± 19.3 pmol mmol−1 in R, but remained constant (157.89 ± 7.81 pmol mmol−1 to 161.81 ± 8.15 pmol mmol−1) in NR (P group over time = 0.043; Fig 2f). The Adaptation Index, a marker of β-cell function, increased from 5.16 × 10⁴ ± 3,833.80 a.u. to 5.78 × 10⁴ ± 5,145.06 a.u. in R and remained unchanged (4.61 × 10⁴ ± 2,192.89 a.u. to 4.74 × 10⁴ ± 2,554.91 a.u.) in NR (P group over time = 0.025; Fig. 2g). An overview of the changes in the hyperbolic relationship between insulin sensitivity and insulin secretion for the two groups is given in Fig. 2h. The hyperbola shows that while R were able to increase insulin sensitivity and secretion at the same time, NR did not improve insulin sensitivity or insulin secretion. Change of hepatic insulin clearance was not different between groups (3.91 ± 0.36 a.u to 3.68 ± 0.4 a.u in R versus 3.39 ± 0.17 a.u to 3.31 ± 0.16 a.u in NR, P group over time = 0.49; Fig. 2i) and, thus, cannot explain the increase in insulin concentrations observed in R. With the increase in insulin secretion and β-cell function alongside improved insulin sensitivity, remission mechanisms without weight loss differ from weight-loss-associated prediabetes remission, where the increase in insulin secretion has not been observed previously.
Because insulin sensitivity and secretion are linked with ectopic adipose tissue deposition, we then determined lipid accumulation in SCAT, VAT and ectopic lipid depots based on the MRI and 1H-spectroscopy data. Intrahepatic lipid content (IHL) was slightly higher in NR versus R but remained constant in both groups during the LI (5.08 ± 1.71% to 5.9 ± 1.74% in R versus 7.65 ± 1.14% to 8.13 ± 1.18% in NR, P group over time = 0.74), suggesting no critical contribution of changes in IHL for nonweight-loss remission. However, while VAT did not increase in R despite weight gain, it increased along with weight gain in NR (4.31 ± 0.69 l to 4.24 ± 0.69 l in R versus 4.99 ± 0.32 l to 5.41 ± 0.36 l in NR, P group over time = 0.031). In contrast, SCAT increased more in R versus NR (14.41 ± 2.39 l to 15.7 ± 2.06 l in R versus 14.97 ± 1.06 l to 14.66 ± 0.98 l in NR, P group over time = 0.035) showing that with weight gain, R predominantly stored additional energy in SCAT but NR in VAT. This is reflected in a substantial increase in SCAT/VAT ratio in R, whereas the ratio tended to decrease in NR (4.01 ± 0.67 to 4.94 ± 0.93 in R versus 3.42 ± 0.25 to 3.14 ± 0.26 in NR, P group over time < 0.0001). Change in intramuscular fat was not different between groups (5.85 ± 1.24% to 6.15 ± 1.49% in R versus 6.4 ± 1.45% to 6.76 ± 1.49% in NR, P group over time = 0.83). These data highlight that lipid deposition during weight gain is most likely a crucial factor for improvements in glucose regulation during non-weight-loss prediabetes remission.
[..] more NR than R developed T2D leading to a relative risk (RR) reduction of 71% in R over the period of up to 10 years (RR = 0.29, 95% CI = 0.09–0.91, P = 0.02z0 and thus prediabetes remission without weight loss was comparably protective for T2D development as prediabetes remission with weight loss (73%).
Our data show that remission of prediabetes without weight loss is a genuine and reproducible response to an LI in a substantial proportion of participants (up to 22%) and that the response is highly effective in preventing T2D. Individuals going into remission without losing body weight are characterized by increased SCAT/VAT ratio, indicating that the site of fat deposition during an LI determines the probability of prediabetes remission. Elegant studies have shown that physical exercise reduces glycemia with no or only marginal effects on body weight. [..] exercise without a weight loss effect can specifically reduce VAT. Additionally, diet composition has a role in VAT accumulation—diets high in polyunsaturated fatty acids have been shown to protect against VAT gain compared to those rich in saturated fats, even during overfeeding and weight gain. Thus, physical exercise and dietary habits may have contributed to lower glycemia and to the observed SCAT and VAT distribution phenotype.
[..] prediabetes remission without weight loss was protective from T2D development with an RR reduction of >70%, and thus to a comparable degree as weight-loss-induced prediabetes remission in the previous study. Taken together, these data show that distinct physiological mechanisms underlie non-weight-loss-induced remission of prediabetes and that it is essential to differentiate between weight-loss and non-weight-loss strata, when investigating the mechanisms that can mediate prediabetes remission. Moreover, our data suggest that weight loss, as recommended in current guidelines, should be complemented by remission to NGR to prevent T2D in those people with prediabetes. This is in line with recent efforts delineating the clinical heterogeneity of obesity in projection for cardiometabolic diseases, specifically when cardiometabolic risk is discordant with the risk that is to be expected when obesity is classically defined solely by the BMI. Furthermore, new statements and definitions of expert commissions for the diagnosis and management of obesity highlight the importance of body fat distribution and function beyond adiposity and underscore the clinical manifestation of organ dysfunction for the diagnosis of clinical obesity.
While body weight trajectories were similar between groups, fat accumulation in SCAT was mainly observed in R and accumulation in VAT was observed in NR. [..] large amounts of SCAT in combination with little visceral adiposity are associated with high insulin sensitivity during a hyperinsulinemic–euglycemic clamp. Exercise can favorably influence SCAT composition, even without weight loss, and SCAT of regularly exercising individuals is more expandable than that of sedentary people with obesity. The importance of exercise for improving insulin sensitivity has previously been demonstrated; however, lean body mass and VO2 max, a marker of maximum aerobic capacity, were not different between R and NR. Nonetheless, we cannot rule out that subtle differences in physical exercise (volume) may have impacted insulin sensitivity. [..] Interestingly, thiazolidinediones (TZDs), a class of oral glucose-lowering medications that activate the transcription factor, peroxisome proliferator-activated receptor γ, led to a redistribution of fat mass from VAT to SCAT depots. TZDs act as insulin sensitizers at least in part by this mechanism. They have also been shown to increase body weight and to improve insulin sensitivity and β-cell function, similar to our observation with nonweight-loss prediabetes remission. [..]
Prediabetes remission without weight loss reduced the risk of subsequent T2D by 71% in our study. Previous studies of people with weight-loss-induced prediabetes remission showed similar risk reductions (73%), which is comparable to T2D risk reduction induced by pharmacological interventions. In a post hoc analysis from the PROactive trial, weight gain with pioglitazone, a TZD, which leads to weight gain with a redistribution from VAT to SCAT and improvements in insulin sensitivity, was associated with improved CV outcomes (excluding heart failure). Interestingly, recent data from our group show that prediabetes remission, in contrast to multimodal LIs targeting mainly weight loss, is also associated with reduced CV outcomes.
Together, these data indicate that there is a weight-independent component of the glycemic status, which is related to body fat distribution. Indeed, individuals reaching both prediabetes remission and the guideline-recommended weight loss target of 7% are 76% less likely to develop T2D, compared to the group that only met the weight loss target. These data highlight the importance of incorporating glycemic targets into practice guidelines in addition to weight loss targets. Remission of prediabetes is the most effective way to prevent future T2D cases, and our current data indicate that this is partially independent of weight loss. In fact, sustainable weight loss is rarely achievable with >90% of weight loss recidivism and the probability of obtaining normal body weight is very low with less than 1 per 1,000 for men and less than 1 per 600 for women in individuals with severe obesity. Therefore, from a clinical perspective, primary treatment goals should focus on achieving metabolic health rather than weight loss alone. Bringing prediabetic hyperglycemia back to normoglycemia seems to be an important contribution and indicator for metabolic health.”
Full article, A Sandforth, EV Arreola, RL Hanson, et al. Nature Medicine, 2025.9.29