2020.7.29
“physicians must rely on personal impressions of the benefits and harms of each preventive service, taking into account differences across patients in risk factors. Mathematical models have been used to rank preventive services based on the potential to add life-years, improve quality of life, or lower costs, but how these rankings compare with clinical practice is unknown. Finally, prioritization could be more important in short encounters compared with longer annual wellness visits. Our goal was to understand whether primary care physicians prioritize the preventive services they discuss with patients and the factors influencing their priorities, especially visit length, patient risk factors, and potential to improve life expectancy.
[..] We used a previously published mathematical framework to individualize an expectation about the years of life gained from each preventive service recommended (grade A or B) by the USPSTF [see 2013 paper and editorial for details].
[..] The top-rated factors influencing physician recommendations were ability to improve patient quality of life (mean score, 4.56; 95% CI, 4.44-4.68) or length of life (mean score, 4.53; 95% CI, 4.40-4.66), followed by recommendation from the electronic health record (mean score, 4.17; 95% CI, 4.03-4.31) or professional organizations/guidelines (mean score, 4.36; 95% CI, 4.23-4.49).
[..] inconsistencies [in physician recommendations] suggest a need for tools to facilitate prioritization in clinical practice, although only approximately 1 of 3 physicians stated they would appreciate such help. Unfortunately, the few tools that currently exist are early stage and not ready for widespread implementation.
Other factors may have influenced physicians’ choices. Nearly half of physicians reported that likelihood of patient adherence was an important factor for prioritization, which may have contributed to low prioritization of lifestyle interventions. Diet and exercise interventions are rarely successful in primary care, instead requiring intensive 9- to 12-month programs for low-to-moderate improvements, and for patients with obesity, the chance of sustaining weight loss is less than 1%. Time required to discuss lifestyle changes in the primary care setting and access to lifestyle counselors also may be barriers, reducing physicians’ prioritization. Physicians may also view lifestyle changes as contributing to blood pressure, diabetes, and lipid level control, rather than as separate goals. In addition, physicians in accountable care organizations may be incentivized to focus on attainment of quality metrics, which usually do not include diet and exercise, potentially influencing our results. In contrast, smoking cessation was a highly prioritized lifestyle change, perhaps because of a higher chance of success (3%-17% per quit attempt). We caution that while considering average adherence rates to interventions (eg, obesity control less likely than hypertension control) may be reasonable, careful consideration should be given before individualizing estimated adherence rates by patient; failure to do so could inadvertently exacerbate health disparities for minorities.
[..] Physicians did not prioritize weight loss, healthy diet, and exercise, despite large potential for gains in life expectancy. Future research may consider how health care systems can better incentivize lifestyle changes and whether physicians and patients would benefit from guidance on preventive care priorities in a time-limited setting.”
Assessment of Physician Priorities in Delivery of Preventive Care, Zhang JJ, Rothberg MB, Misra-Hebert AD et al. JAMA Network Open, 2020.7.27
2020.7.28
“On November 7, 2019, the German parliament (Bundestag) adopted the Digital Healthcare Act (Digitale-Versorgung-Gesetz or DVG), which was subsequently approved by the Federal Council (Bundesrat) and signed into law by the German President. In addition to promoting the use of telehealth and ensuring better usability of health data for research purposes, the new law entitles all individuals covered by statutory health insurance to benefits for certain digital health applications (i.e., insurers will pay for their use).
[..] In general, insured persons are entitled to coverage benefits for digital health applications if such applications meet the following criteria:
- They are lower-risk medical devices;
- Their main function is essentially based on digital technologies;
- They are intended to support the monitoring, detection, relief or treatment of illnesses or the compensation, detection, relief or treatment of injuries or disabilities in the case of injured persons or in care provided by service providers;
- They have been included in a newly established official register for digital health applications maintained by the German Federal Institute for Drugs and Medical Devices (Bundesinstitut für Arzneimittel und Medizinprodukte—BfArM); and
- They are used either with the approval of the health insurer or with the prescription of the treating physician or psychotherapist (SGB V, § 33a(1)).
[..] If the manufacturer satisfies all requirements except the last one (i.e., positive effects on care—“positive Versorgungseffekte”), the digital health application can be included in the register for a preliminary (testing) period of 12 months (SGB V, § 139e(4)) (Fig. 1), during which time the manufacturer must provide evidence of its effects on care. The explanatory memorandum clarifies that such effects constitute one of two things: (1) a medical benefit (i.e., a therapeutic improvement by positively influencing patient-relevant endpoints such as quality of life), or (2) procedural and structural improvements to health care—e.g., the promotion of patient information and patient sovereignty, better coordination of care processes, etc6. The memorandum also clarifies that the medical benefit can be demonstrated via expert opinions, case reports, application observations, studies, or other valid findings6. If the manufacturer does not manage to provide sufficient evidence within the first year, the BfArM can extend the deadline for a further 12 months if, based on the preliminary information submitted, there is a high likelihood of later verification (SGB V, § 139e(4)).
[..] Once a digital health application is included in the register, the National Association of Statutory Health Insurance Funds (“GKV-Spitzenverband”) begins the process of negotiating a standardized reimbursement price (“negotiated price”) with the manufacturer (SGB V, § 134(1)). This price then applies to all statutory health insurers 12 months after the entry of a digital health application into the register (SGB V, § 134(1)). During the first year, the manufacturer’s list price applies (SGB V, § 134(5)). In the case that the manufacturer and the National Association of Statutory Health Insurance Funds cannot agree on a negotiated price within one year, an arbitration board will set the reimbursement price within three months (SGB V, § 134(2)). This process has many similarities to that of reimbursement for new pharmaceuticals by German statutory health insurers, in which negotiated prices only apply after the first year of the product being placed on the market following a formal benefit assessment (SGB V, § 130b)
[..] in the absence of a broad set of standards for digital health reimbursement such as those introduced in Germany through the DVG, even clinically-proven digital health solutions struggle to define a viable reimbursement strategy in the US market, as neither patients nor physicians believe that they should bear the cost of such tools. Moreover, payers, who stand to benefit most from the widespread adoption of effective digital health solutions due to their potential to reduce overall costs, are not operationally equipped to ensure their clinically appropriate adoption and/or ongoing compliant use.
[..] First, non-medical devices fall a priori outside of the DVG. Second, digital health applications that are categorized as class IIb or class III devices are also not covered by the Act. For example, certain clinical decision support software under the new MDR (“software intended to provide information which is used to take decisions with diagnosis or therapeutic purposes (…) [and] have an impact that may cause (…) death or an irreversible deterioration of a person’s state of health (…) or a serious deterioration of a person’s state of health or a surgical intervention”) will fall outside of the scope of the DVG (Rule 11 in Chapter III of Annex VIII of the MDR). [..] a software app that drives an implantable device like a pacemaker would be classified as a high-risk device and would fall outside of the scope of the DVG’s provisions. Third, the DVG does not apply to those class I- and class IIa-devices that fail to fulfill the other requirements, such as those whose main function is not essentially based on digital technologies.
[..] Some patient advocates have raised the criticism that the DVG does not enable patients to opt-out of sharing their demographic data collected by health insurers for research purposes, with some data privacy activists filing an unsuccessful petition in mid-November 2019 asking the German president to not sign the DVG into law.
[..] Among OECD countries, Germany’s DVG represents a first-of-its-kind opportunity for large-scale reimbursement of evidence-based digital health applications.”
Germany’s digital health reforms in the COVID-19 era: lessons and opportunities for other countries, Gerke S, Stern AD and Minssen T. NPJ Digital Medicine, 2020.7.10.
2020.7.27
“Every year, hospitals are ranked or rated by public and private organizations that aim to identify centers that provide high-quality health care. Although the reports are intended to help guide consumers in determining where to seek care, these ranking systems often yield conflicting information or, worse, misinformation for patients and their clinicians.
[..] The broad effect of regional variation in health outcomes is exemplified by widely varying life expectancy across the US. Areas with the lowest life expectancy have lower socioeconomic status and a higher proportion of African Americans. When the US News & World Report Best Hospital Honor Roll of 21 hospitals and life expectancy are combined, a pattern emerges: only regions with higher life expectancy have hospitals on the Honor Roll, whereas regions with lower life expectancy (such as the entire Southeast region, including Alabama, Florida, Georgia, North Carolina, South Carolina, and Tennessee) have none. Many hospitals in these states provide excellent care, yet are not recognized on this listing.
A likely explanation for these regional differences is that hospital rankings reflect the underlying health status of the population served, as influenced by its socioeconomic environment, racial and ethnic composition, and life expectancy. The majority of the 21 hospitals on the honor roll have in their communities at least one separate city- or county-supported public hospital that serves a disproportionate number of disadvantaged patients in the community. As a result, hospitals listed on the honor roll are advantaged in that most do not care for the most disadvantaged patients who tend to have worse health outcomes.
[..] The visibility of hospital rankings and the desire to achieve and promote a high ranking in consumer-facing advertisements may prompt hospitals to invest in strategies to improve their rankings whether or not those strategies improve care delivery and outcomes. Even more insidiously, hospitals may avoid caring for the highest-risk, most vulnerable patients, further exacerbating disparities in care delivery. The expenditures for licensing fees to use US News & World Report Best Hospital rankings in hospital advertisements or on improvement efforts targeted toward improving the rankings are unlikely to benefit patients directly.”
The authors recommend several improvements including:
- Account for population differences between regions
- Shift from rankings to ratings
- Bring attention to measures that matter to patients (e.g., quality-of-life, preventive care, longitudinal outcomes, healthcare value)
- Increase transparency and reproducibility of results
National Hospital Quality Rankings: Improving the Value of Information in Hospital Rating Systems, Bae JA, Curtis LH, and Hernandez AF. JAMA 2020.7.27
2020.7.22
“An estimated 1 in 3 outpatient clinic visits are made by adults with hypertension, and most adults with hypertension see their clinician multiple times per year. Nonetheless, most adults in the United States with hypertension experience uncontrolled disease. Patient-level factors play a role, including medication nonadherence and reluctance for treatment intensification. However, decades of research have shown that therapeutic inertia, or a clinician’s failure to intensify therapy in response to uncontrolled blood pressure (BP), contributes substantially to the ongoing burden of hypertension.
[..] Several lines of evidence have prompted the current interest in combination therapy, in particular the use of fixed-dose combination (FDC) pills (also called polypills). Observational data suggest that those who initiate treatment with combination therapy are more likely to achieve BP control than those starting with multipill combinations or monotherapy. Furthermore, since 2017, multiple trials have shown that FDC therapy may improve BP control compared with usual care.
One of these studies, the Triple Pill Vs Usual Care Management for Patients With Mild to Moderate Hypertension (TRIUMPH) study, randomized 700 patients in Sri Lanka to usual care or a once-daily FDC pill containing 20 mg of telmisartan, 2.5 mg of amlodipine, and 12.5 mg of chlorthalidone. Those randomized to FDC were more likely to achieve BP control (70% vs 55%) at 6 months, with an overall difference in systolic BP of 9.8 mm Hg in the treatment arm vs the usual care arm.
[..] a notable 30% of patients failed to achieve BP control [<140/90 mm Hg or <130/80 mm Hg in patients with diabetes or chronic kidney disease] at the final follow-up visit. [..] Among those who continued to have uncontrolled BP, the proportion of patients who had their medications uptitrated was lower in the FDC arm compared with usual care at both 6 weeks (13% vs 36%) and 12 weeks (10% vs 35%). This finding suggests that clinicians were less likely to uptitrate therapy in patients receiving FDC. Had uptitration occurred in the FDC arm at the same rate as it did in the usual care arm, the advantage in BP control in the FDC group compared with usual care may have been even greater at the end of the trial.
[..] More than half of participants with residual hypertension failed to have their medications increased, regardless of the initial treatment strategy. This is consistent with a large body of observational data. Those allocated to FDC therapy at baseline had better BP control at 6 and 12 weeks compared with usual care, such that fewer patients in the FDC arm required uptitration of medications in the first place. Thus, even if use of FDC pills increased therapeutic inertia, the negative outcome was offset by the substantial upfront advantage in BP control.
[..] Implementation of FDC into clinical practice should be part of longitudinal care pathways, with reassessment of BP over time and algorithms to uptitrate therapy for those whose BP remain greater than the goal value. Similar considerations apply to assessment of lipids if the use of polypills containing both antihypertensive medications and statins becomes widespread.
[..] Initiating treatment with FDC therapy does not preclude a more personalized approach for those who do not reach their BP goal, with subsequent uptitration of medications based on patient-specific factors. The real question now is the choice of initial treatment. Multiple randomized clinical trials have demonstrated the safety and effectiveness of FDC pills in hypertension management. Future guidelines should consider allowing clinicians to consider an FDC-first approach for a broader population of patients than is currently recommended.”
Choosing an Initial Therapeutic Approach for Hypertension—Time for a Fixed-Dose Combination First? Navar AM and Wang TJ. JAMA Cardiology 2020.7.22
2020.7.21
Essential indicators for Effective COVID-19 response now:
- New confirmed and probable cases and per capita rates by date with 7-day moving average (stratified by age, sex, race, ethnicity and zip code with a separate marker for outbreaks versus community)
- Percentage of new cases epidemiologically linked to at least one other case, stratified by whether part of known outbreak or not, with threshold (further stratified by age, sex, race and ethnicity)
- New screening (e.g., antigen) and diagnostic (e.g., PCR) testing per capita rates by date, with threshold, with 7-day moving average (stratified by age, sex, race and ethnicity)
- Percentage of screening screening (e.g., antigen) and diagnostic (e.g., PCR) tests positive by date, with threshold, with 7-day moving average (stratified by age, sex, race and ethnicity)
- COVID-like illness (CLI) and influenza-like illness (ILI) trends from emergency departments
- COVID-19 daily hospitalization per capita rates and 7-day moving average (stratified by age, sex, race and ethnicity)
- Percentage of licensed beds occupied by suspected and confirmed COVID-19 patients
- List of long-term care and other congregate facilities (homeless shelters, correctional facilities), and essential workplaces (e.g., meatpacking) outbreaks with COVID-19 cases and deaths in residents and staff (cumulative and most recent week)
- New COVID-19 confirmed and probable deaths and per capita rates with 7-day moving average (stratified by age, sex, race, ethnicity and zip code with a separate marker for outbreaks versus community)
Essential indicators for Effective COVID-19 response in the near future:
- Diagnostic (e.g., PCR) test turnaround time (specimen collection to test report), by week (stratified by age, sex, race, ethnicity)
- Time from specimen collection to isolation of cases, by week (stratified by age, sex, race, ethnicity)
- Percentage of cases interviewed for contact elicitation within 48 hours of case specimen collection, including all people wth positive tests who reside in the jurisdiction, by week (stratified by age, sex, race, ethnicity)
- Percentage of new cases from among quarantined contacts, by week (outbreaks versus community)
- New infections among health care workers not confirmed to have been contracted outside of the workplace, by week (stratified by age, sex, race, ethnicity)
- Percentage of people wearing masks correctly in public indoor settings (e.g., mass transit, shopping), based on direct observation or security camera analysis, by a standard, consistent method, by week
Tracking COVID-19 in the United States: From Information Catastrophe to Empowered Communities
2020.7.20
“In 2014, 3 major cardiovascular organizations formulated guidelines and issued a class 1 recommendation for the use of shared decision-making (SDM) to individualize the anticoagulant treatment of patients with nonvalvular AF [atrial fibrillation] who are at risk of experiencing stroke.
[..] The aim of the current study was to assess the extent to which the use of the Anticoagulation Choice Shared Decision Making tool affects the quality of SDM and anticoagulant treatment decisions in patients with AF who are at risk of experiencing stroke.
[Methods] Patients were classified into 1 of 2 cohorts: start and review. The start cohort comprised patients who were new to the receipt of anticoagulant treatment [..]. During the clinical trial, the practice of prescribing a DOAC [direct oral anticoagulant] medication in the emergency department and referring the patient to an outpatient clinic for full discussion of anticoagulant treatment led us to modify the protocol by including in the start cohort all patients who had been prescribed an anticoagulant medication within 10 days of the clinical trial encounter but were otherwise new to the receipt of anticoagulant treatment. The review cohort comprised patients who were currently receiving ongoing anticoagulant medication or who had received anticoagulant medication within the past 6 months.
[..] In the intervention arm, clinicians were asked to use the Anticoagulation Choice Shared Decision Making tool in their encounters. This tool is a freely available online conversation aid that is designed for use within the encounter. The tool calculates the patient’s risk of stroke using the CHA2DS2-VASc score and provides the patient’s individualized risk of experiencing stroke at 1 year or 5 years, with and without anticoagulant treatment, using natural frequency expressions (eg, “out of 100 people like you”) and 100-person pictographs that illustrate the proportion of people experiencing nondisabling strokes, disabling or fatal strokes, or no such events. The tool then supports the comparison of available anticoagulant treatment options (ie, warfarin and DOAC medications) across patient-important issues, such as how to use the medications, the need for periodic monitoring, the reversibility of anticoagulant treatment, the estimated out-of-pocket costs, and the association of lifestyle or medical factors with the risk of bleeding (using the HAS-BLED [hypertension, abnormal kidney or liver function, stroke, bleeding, labile international normalized ratio, elderly age (>65 years), and drug or alcohol use] estimator; score range, 0-9, with higher scores indicating higher risk). The tool offers a patient report and tailored text that can be copied into the clinical note to document the conversation and the decision.
[Results] No significant difference was observed between study arms with regard to patients’ accuracy of their own perceived risk of stroke using both the strict threshold (30 of 445 patients [6.7%] in the intervention arm vs 24 of 434 patients [5.1%] in the standard care arm; adjusted relative risk [aRR], 1.4; 95% CI, 0.8-2.2) and the liberal threshold (49 of 445 patients [11.0%] in the intervention arm vs 40 of 434 patients [9.2%] in the standard care arm; aRR, 1.3; 95% CI, 0.8-1.8). Decisional conflict was low (Decisional Conflict Scale unadjusted mean [SD] score, 16.6 [14.4] points in the intervention arm and 17.9 [14.9] points in the standard care arm), and patient-clinician concordance about treatment selection was high in both arms (381 of 434 patients [87.8%] in the intervention arm vs 369 of 424 patients [87.0%] in the standard care arm), with no significant between-arm differences (aRR, 1.0; 95% CI, 0.9-1.1).
[Discussion] Compared with the findings of 105 randomized clinical trials of SDM interventions that were included in a 2017 Cochrane systematic review, the present clinical trial yielded similar results, with the exception of no significant improvements in patient knowledge or decisional conflict (both were reported to improve in the review) and no significant change in encounter duration (reported to lengthen by 3 minutes in the review). Overall, the present study is, to our knowledge, one of the largest SDM clinical trials conducted and one of the few to intervene in the clinical encounter and directly observe SDM behaviors, fidelity of use, and contamination.
[..] Whether a more selective implementation approach could yield larger effects remains unclear and deserves examination. Such an examination may need to focus on patients who may find it difficult to decide whether or how to use anticoagulant treatments, such as patients with low to intermediate stroke risk, patients who have experienced difficulty maintaining therapeutic international normalized ratio levels, or patients who find DOAC medications unaffordable. Some explorations are currently occurring in an ongoing multicenter randomized clinical trial funded by the American Heart Association and the Patient Centered Outcomes Research Institute that compares standard care, an SDM encounter tool, a patient decision aid, or a combination of these options.
The findings of this clinical trial contribute to the discussion of the recommendations for SDM in published guidelines, which inspired this clinical trial, and the mandated use of SDM by payers as a requisite for reimbursement. Both practices assume that clinicians and health care systems can implement forms of SDM that are capable of responding effectively to the problematic situation for which patients seek care. The finding that the patient’s highest priority led the discussion in only a limited number of SDM encounters challenges this assumption. There is a clinical and ethical need for patients and clinicians to work together to form plans of care. How best to do so remains to be determined. Furthermore, it remains necessary to develop ways of identifying which patients, decisions, encounters, and clinicians need more support to enact which form of SDM. The results of the present study suggest it may be premature to proceed with a wholesale implementation of SDM tools that is sustained by mandates or financial incentives.”
Assessment of Shared Decision-making for Stroke Prevention in Patients With Atrial Fibrillation: A Randomized Clinical Trial, Kunneman M, Branda ME Hargraves IG et al. JAMA Internal Medicine 2020.7.20
2020.7.18
“Current methods tend to focus on traditional comorbidity representations, such as simple summaries of individual conditions (eg, counts, sums, and most recent values) or aggregate measures of comorbidities. Unfortunately, these representations do not reflect an individual’s comorbid disease history and severity and do not account for interactions with different treatment pathways. Therefore, this leaves a large gap in our knowledge regarding how to optimally manage complex MCCs [multiple chronic conditions].
To address this critical knowledge gap, we introduce a novel representation of patient data, disease severity hierarchy (DSH), which explores diseases and their known treatment pathways in a nested fashion. As the DSH tree is traversed from the root to the leaves, subpopulations of patients with similar clinical characteristics, such as disease severity, progression, and survival, are created, thereby providing discriminative features suitable for developing risk stratification models
[..] The comorbidities, laboratory results, vital signs, and medications were captured throughout BTW [baseline time window]; as such, a patient may have repeated measurements of the same variable. These potentially correlated measurements present a major challenge for conventional machine learning methods. Therefore, we aggregated the repeated observations for each patient to create cross-sectional data. We created 2 comorbidity variables (the rolling comorbidity, the condition persisted throughout the BTW, and the most frequent value), 2 medication variables (the number of times [frequency] the patient received any medication class and an indicator for the presence or absence of any class), and 3 variables for laboratory results and vital signs (frequency, median, and last observed value in BTW).
[..] The proposed DSH is designed to address how heterogeneous diseases, such as diabetes, can be modeled without explicitly knowing the underlying disease mechanisms. It accomplishes this goal by transforming the multifaceted heterogeneous EHR data into a clinically meaningful patient state representation that uniquely captures and encodes known relationships about disease severity, treatment pathways, and outcomes. For each clinical encounter, we extracted diagnoses, laboratory results, vital signs, and interventions to construct the DSH representing the patient’s health trajectory as a sequence of clinical findings.
[..] DSH-RS [disease severity hierarchy with risk score only] substantially outperformed COM [comorbidities with medications]. Specifically, models using DSH-RS achieved outstanding AUCs [areas under the curve] in predicting ACM [all-cause mortality] at 60, 65, 75, and 80 years on REP [Rochester Epidemiology Project] data of 0.96 (95% CI, 0.94-0.97), 0.96 (95% CI, 0.95-0.98), 0.97 (95% CI, 0.96-0.98), and 0.98 (95% CI, 0.98-0.99), respectively, while models using COM produced modest AUCs of 0.67 (95% CI, 0.55-0.80), 0.66 (95% CI, 0.56-0.79), 0.64 (95% CI, 0.57-0.71), and 0.63 (95% CI, 0.54-0.70), respectively. Adding laboratory results and vital signs to COM (ie, COM + LB/VS) improved the performance of COM, resulting in AUCs between 0.73 and 0.87; however, the performance was still inferior to DSH-RS.
[..] Unlike conventional methods of representing comorbidities as independent, time-invariant, and simple summaries, DSH offers explicit relationships for progression and severity of comorbidities as they relate to health status. We showed that these associations between comorbidities and their severity inform clinical risk stratification. This simple and expressive yet succinct representation of health status can be easily introduced to many clinical analysis processes and has the potential to greatly improve predictions. We demonstrated this capability by predicting age-time of ACM and MCE [major cardiovascular events] based on DSH representation of type 2 diabetes and its comorbidities. Models based on DSH representations outperformed models based on individual comorbidities, medications, laboratory results, and vital signs.”
Development and Validation of a Risk Stratification Model Using Disease Severity Hierarchy for Mortality or Major Cardiovascular Event, Ngufor C, Caraballo PJ, O’Byrne TJ et al. JAMA Network Open 2020.7.17
2020.7.15
“In 2019, Medicare started paying for brief communications or Virtual Check-Ins, which are different from traditional Medicare telehealth visits as they are brief patient-initiated communications with a health care practitioner and not limited to patients residing in rural areas.
[..] And starting in 2020, Medicare separately has paid clinicians for e-visits, which are non-face-to-face, patient-initiated communications through an online patient portal. These types of services don’t require Medicare patients to go to the doctor’s office and are available in all types of locations including the patient’s home, and in all areas of the country (not just rural areas).
[..] Before the public health emergency, approximately 13,000 beneficiaries in fee-for-service (FFS) Medicare received telemedicine in a week. In the last week of April, nearly 1.7 million beneficiaries received telehealth services.
[..] over 9 million beneficiaries have received a telehealth service during the public health emergency, mid-March through mid-June. Specifically, data points presented in this section of the post are from internal CMS analysis of Medicare FFS claims data from March 17through June 13, 2020 (using data processed through June 19, 2020). Telemedicine services include services on the Medicare telehealth list including audio-only visits, as well as virtual check-ins and e-visits.
[..] In rural areas, 22 percent of beneficiaries used telehealth services, and 30 percent of beneficiaries in urban areas did so.
[..] 30 percent of female beneficiaries and 25 percent of male beneficiaries have received telemedicine services during the COVID-19 public health emergency to date. Across all age groups, 25-34 percent of beneficiaries have received a telemedicine service (34 percent among beneficiaries below the age of 65, 25 percent among beneficiaries between ages 65-74, 29 percent among beneficiaries between ages 75-84, and 28 percent among beneficiaries older than 85). There are also no significant differences by race or ethnicity among beneficiaries who received telemedicine services (25 percent among Asians, 29 percent among Blacks, 27 percent among Hispanics, 28 percent among Whites, and 26 percent among others).
Dually eligible beneficiaries (low-income beneficiaries that qualify for both Medicare and Medicaid) have had higher rates of telemedicine use: 34 percent of dually eligible beneficiaries have had a telemedicine service, compared to 26 percent of Medicare-only beneficiaries. Even among dually eligible beneficiaries, there are no significant differences across race or ethnicity groups (30 percent among Asians, 34 percent among Blacks, 33 percent among Hispanics, 35 percent among Whites, and 31 percent among others).
Evaluation and management (E/M) visits, or office visits, have been the most common form of telehealth, with nearly 5.8 million beneficiaries receiving an E/M telehealth visit since the public health emergency started. Additionally, 38 percent of beneficiaries who had an E/M visit furnished during the public health emergency did so via telehealth. Another area where telehealth has been used frequently has been mental health services with a psychiatrist or psychologist: approximately 460,000 beneficiaries (or 60 percent) receiving this care through telehealth. Telehealth for mental health care is showing great promise for our Medicare beneficiary population, who may otherwise have felt stigmatized seeking out care in-person.
The use of audio-only telehealth services has also been shown to be helpful for the Medicare population during the public health emergency, as many patients may not have access to or feel comfortable using video technology. Over 3 million beneficiaries have received telehealth services via traditional telephone. That means nearly one-third of beneficiaries that received a telemedicine service did so using audio-only telephone technology.”
Early Impact Of CMS Expansion Of Medicare Telehealth During COVID-19, Verma S. Health Affairs Blog 2020.7.15
2020.7.14
“In Maryland, a public agency called the Health Services Cost Review Commission negotiates a budget with each hospital, with rates then set for all public and private payers so that revenues add up to this budget. In January 2019, Pennsylvania’s Department of Health and CMS launched a prospective all-payer global budgeting model for rural hospitals. The model is in its second performance year and now includes 13 hospitals and 5 commercial payers in addition to CMS. These all-payer models shift hospitals from fee-for-service reimbursement for all payers. To date, evidence has shown that the budgets help to stabilize financially challenged hospitals, incentivize hospitals to improve population health, render care in the most appropriate setting, and slow health care cost growth.
[..] While there are signs that the pandemic may accelerate the closure of rural and safety-net hospitals, hospitals participating in Maryland and Pennsylvania’s global budgets are relatively protected from catastrophic fluctuations in finances. For example, in Maryland, regulators have allowed hospitals to shift the location of services and raise rates over the next year to partially compensate for substantial declines in visits and elective procedures. At the same time, regulators have made plans to increase budgets if needed to respond to a surge in patients with COVID-19.
[..] The single ACO model launched in 2018 by Vermont and CMS engages both public and private payers. In its first 3 years, the ACO has been associated with a reduced rate of inpatient admissions and emergency department visits. It has also saved the Medicaid program $97 million.
[..] The CMS and commercial payers can learn these lessons by seizing the moment to promote innovative payment models. These can support switching to virtual visits when convenient, adopting hospital-at-home programs, growing food-as-medicine pilot programs and other programs aimed at social contributions to health, and creating remote monitoring and new models of care management. The opportunity is not only to provide high quality at lower cost but also to reduce the patient traffic that fosters the spread of COVID-19 inside and outside of health care settings.”
Resilience in Health Care Financing, Murphy K, Koski-Vacirca R and Sharfstein J. JAMA 2020.7.14
2020.7.13
“This study compared the health of US adults aged 55 to 64 years with the health of their peers in England.
[Methods] The Health and Retirement Study (HRS) is a longitudinal biennial survey of approximately 20 000 Americans older than 50 years that started in 1992. The HRS collects extensive health information as well as sociodemographic characteristics. [..] The English Longitudinal Study of Ageing (ELSA) is a biennial longitudinal household survey of English adults aged 50 years or older that began data collection in 2002 including detailed health and sociodemographic measures. The ELSA was developed with a goal of using methods and survey questions that are comparable to the HRS to facilitate cross-national comparisons.
[..] Five measures of self-assessed health outcomes were any functional limitation (climbing 1 flight of stairs; climbing several flights of stairs; getting up from a chair; picking up a dime; reaching or extending arms upward; pushing or pulling large objects; sitting for 2 hours; lifting or carrying 4.5 kg; and stooping, kneeling, or crouching), difficulty with any instrumental activity of daily living (IADL) (using the telephone, managing money, taking medication, shopping, and preparing meals), difficulty with any activity of daily living (ADL) (walking across the room, dressing, bathing, eating, getting in or out of bed, and using the toilet), fair or poor self-rated general health, and depressive symptoms according to the 8-item Center for Epidemiologic Studies Depression Scale (CES-D8).
[Results] The proportion of adults with a high level of education was greater in the US compared with England (31.9% vs 21.9%; P < .001), and US adults were more likely to have never smoked (45.1% vs 39.1%; P < .001) and to be obese (38.5% vs 34.4%; P < .001).
[..] Median household income of adults aged 55 to 64 years was greater in the US than England for all deciles except for the bottom decile. The median after-tax household income (US dollars) was $3650 in the US vs $5286 in England at the bottom decile in each country during 2008 to 2014. In contrast, the median after-tax household income in the US was more than twice the value in England at the top decile in 2012 ($143 679 vs $70 712), implying higher income inequality in the US (ratio of median within the top vs bottom decile was 39 in the US and 13 in England).
[..] the gap between the bottom 20% and the top 20% on self-assessed health outcomes was substantial for both countries, ranging from a 22 percentage point difference (IADL limitation) to a 38 percentage point difference (fair or poor health) in the US and from a 16 percentage point difference (IADL limitation) to a 33 percentage point difference (fair or poor health) in England. This health gap by income (bottom 20% minus top 20%) was significantly greater in the US than England on functional limitation (US-England difference in the gap was 9.7 percentage points; 95% CI, 5.4-13.9 percentage points), IADL limitation (US-England difference in the gap was 5.3 percentage points; 95% CI, 2.2-8.4 percentage points), ADL limitation (US-England difference in the gap was 4.8 percentage points; 95% CI, 1.3-8.3 percentage points), and fair or poor health (US-England difference in the gap was 4.9 percentage points; 95% CI, 0.7-9.1 percentage points).
[Discussion] These findings persisted after adjusting for demographic factors, educational level, smoking, and body mass index. With the current data we were not able to assess the role of other factors in explaining these findings. We believe, however, that one important factor is that financial insecurity among low-income adults may lead to vulnerabilities that are not as well addressed in the US compared with England. We found that both the relative income and the absolute level of income were lower in the lowest income group among US adults aged 55 to 64 years compared with their peers in England. Both across and within countries, the lowest-income adults in the US had the worst outcome for nearly all 16 measures. At the same time, none of the 16 health outcomes were better in the US than England among the top 2 deciles despite having at least 80% higher income. Health care access appears to be more limited in the US due to the more complicated and fragmented health care system, and many US adults are uninsured, which may result in substantial out-of-pocket costs, especially among low-income individuals in the US. Social welfare programs in the US, separate from health care, are also limited compared with the UK system. These factors may be associated with worse overall health for lower-income US adults compared with those in England.”
Comparison of Health Outcomes Among High- and Low-Income Adults Aged 55 to 64 Years in the US vs England, Choi HJ, Steptoe A, Heisler M et al. JAMA Internal Medicine 2020.7.13
“[Introduction] The 340B program was established in 1992 following changes in the drug market after the establishment of the Medicaid Drug Rebate Program. The Medicaid Drug Rebate Program uses a formula to determine the net price of drugs for the Medicaid program, and that formula requires drug manufacturers to extend the best price offered to any commercial purchaser to the Medicaid program. Following the introduction of the Medicaid Drug Rebate Program, manufacturers were less willing to provide discounts to safety-net institutions and government purchasers because a single discount to one health care organization could reduce the manufacturer’s net revenue for all Medicaid purchases. To fix this unintended consequence, in 1992, Congress passed a series of exclusions from the best price requirement, identifying a variety of health care organizations and government agencies to which manufacturers could extend discounted pricing without triggering best price. As part of this carve-out, Congress required manufacturers to extend net Medicaid pricing (340B discount) to these identified 340B health care organizations (separate discounts were established for government purchasers). The 340B health care organizations include hospitals, clinics, and other facilities that meet federal standards to participate in the 340B program. Currently, these discounts are at least 23.1% of a brand-name drug’s average manufacturer price, which approximates the list price for brand-name drugs; these discounts are greater if the manufacturer has increased prices higher than the rate of inflation.
The 340B statute identifies which health care organizations are eligible to participate in the program; the largest share of discounted 340B sales is to disproportionate share hospitals, a federal hospital status based on the number of Medicaid patients served by the hospital. Other 340B-eligible health care organizations include federally qualified health centers; health care organizations participating in the Ryan White program, which funds HIV care; family planning health care organizations; and hemophilia treatment centers, among others.
When a 340B-eligible health care organization purchases a drug under the 340B program, the manufacturer must sell that drug to the facility at the discounted price. When the health care organization bills an insurer for that drug, however, it is not required to bill the insurer at the discounted cost of the drug, allowing 340B health care organizations to bill insurers at the undiscounted rate. The difference between the discounted purchase price and the reimbursed price is retained by the 340B health care organization and is intended to allow those facilities to “stretch scarce Federal resources as far as possible, reaching more eligible patients and providing more comprehensive services.”
[..] If PBM rebates are high and 340B sales are a significant share of total sales, these combined discounts could significantly reduce net manufacturer revenue. In the HCV [hepatitis C virus] market, where both of these conditions appear to be true, we hypothesize that the manufacturer may prefer to reduce the list price of the drug, reducing both the 23.1% 340B discount and the PBM rebate payment.
[Discussion] Our analysis suggests that, given the high share of 340B sales within the HCV market, reducing a drug’s list price generates greater net manufacturer revenues than the same price reduction via a rebate mechanism. This increase in manufacturer revenues is because with a high list price, the manufacturer would have to pay both a PBM rebate and a higher 340B discount, but with a lower list price and no rebate, the manufacturer faces only a lower 340B discount.
[..] The prevailing preference for rebates over list price reductions may hold at the average 14% 340B market share, but not when the 340B market share exceeds 30% or 40%, as in the HCV market.
[..] The curative nature of HCV treatments and relatively short treatment duration (8-12 weeks) limits future sales potential, as the number of patients requiring HCV treatment will likely decrease and per-patient sales are limited to a single course of treatment. This regimen differs significantly from the markets for chronic diseases, which may require maintenance therapy for the patient’s life span, or age-related disease markets, where the patient population is expected to grow. In these markets, the strategic value of price increases on existing drugs to serve as price floors for new therapies may exceed the revenue effect of the combined growth of 340B discounts and PBM rebates, even for higher 340B-share markets.”
Estimated Changes in Manufacturer and Health Care Organization Revenue Following List Price Reductions for Hepatitis C Treatments, Dickson S and Reynolds I. JAMA Network Open 2019.7.5
2020.7.10
“Digital interactions, using mobile applications, searching the Internet, wearing connected devices, or conversing on social media, often generate health-relevant information. Smart watches and smartphone applications are in widespread use for tracking physical activity, fertility, and blood glucose levels. One step removed, data scientists have been able to identify chronic disease risk or depressed mood based on Internet searches and social media posts. Cars now record whether their drivers have gained or lost weight or strayed from their lanes.11 We refer to the sum of these health-relevant data as an individual’s digital health footprint.
Although the European Union implemented broad new consumer digital privacy regulations in 2018, the US has not adopted a comprehensive regulatory approach. Instead, the US has taken a sector-specific approach, with differential protections conferred on health care encounter data through the Health Insurance Portability and Accountability Act (HIPAA). In addition, genetic information, thought to be particularly sensitive, receives protections under the Genetic Information Nondiscrimination Act (GINA). These regulations leave wide swaths of digital consumer privacy unregulated.
[..] For this qualitative study, we conducted interviews between January 1 and July 31, 2018, using purposive and convenience sampling to recruit 26 participants with diverse expertise in emerging digital technology and applications to health care and research.
[..] Experts rated distinct information streams that contribute to the digital health footprint on a scale from 0 (not at all health related) to 100 (highly health related). They assigned highly variable scores to different information streams, with high scores for the electronic health record (median score, 100; IQR, 85-100), followed by fitness trackers (median score, 72.5; IQR, 52.5-80.0). Lower health-relatedness scores were assigned to commercial genetic profiles (median score, 60; IQR, 50-75), toll-tracking devices (median score, 10; IQR, 5-20), and frequent flyer accounts (median score, 7.50; IQR, 2.75-10.00).
The experts uniformly indicated that there are no clear distinctions between health-related and non–health-related data and that all data can become health data. They noted that data are routinely aggregated across domains and over time, allowing for additional predictive analytics and increasingly precise characterization of health or risks. As one expert noted, “We’re moving from a time where health was measured directly using clinical measures to a new era where health is measured indirectly using…all the available information we leak on a daily basis.”
[..] The experts identified 5 characteristics of the digital health footprint that may be associated with threats to consumer privacy. The first characteristic was invisibility. An expert noted, “It would be very, very odd if someone followed you around…making notes of everywhere you went…and how much money you spent and what you saw and who you interacted with…We would call it stalking, right? But in the digital world, that’s just common behavior.”
[..] Another identified characteristic was inaccuracy. An expert stated, “If you don’t take that information seriously and you think, ‘Oh, it’s just some quiz,’ and maybe you just randomly answer some [joking] response, it might still stick with you.”
[..] The third characteristic was immortality of data. An expert noted, “Say I build a wellness app and I ask you to fill out extensive surveys about yourself…It gets mildly popular and I get an acquisition off of it…the data is going to go into a data broker and get endlessly resold and segmented.”
[..] Marketability was a fourth characteristic identified through the expert interviews. One participant mentioned, “There’s a lot of questions about whether it’s right that companies are selling people’s individual consumer data and then the buyer of data turns it into profitable products and the consumer never benefits from that in any way.”
[..] The last characteristic was identifiability. An expert noted, “Eighty-five percent of people can be re-identified based on 3 GPS points; my home, my office, my children’s school, narrow me down to a really small number of people that that could uniquely be.”
[..] We identified 3 key findings. First, there are no clear distinctions between data that are and are not health related. Second, the digital health footprint is associated with enduring health privacy challenges that transcend specific technologies or applications. Third, the digital health footprint is largely unregulated.
[..] Recognizing that HIPAA only protects the fraction of health information generated in health care encounters, new standards must be developed for the deidentification, use, and protection of information contained in the digital health footprint. In advancing new regulatory approaches, a key challenge is to balance consumer privacy and the limiting of potential harms with the potential for health care advances that may be derived from the digital health footprint.
[..] Even without a specific social or economic harm, ethicists and policy makers have made the case that if a consumer is forced to live in a society in which nothing is private, consumers will lose their sense of individual dignity, potentially eroding social trust or generating adverse psychological sequelae. Without trust, it is difficult for individuals to have meaningful relationships in personal and professional spheres of their lives with long-term social consequences.
The US is notable because of its sector-specific regulatory approach, which shaped HIPAA as the approach to privacy in the health sector. Although specific policy solutions were beyond the scope of our interviews with experts, many pointed to the model of the European Union General Data Protection Regulation. The General Data Protection Regulation establishes individual privacy rights across sectors, codifying expanded transparency of data collection and use, increasing consumer control and data access, and limiting the immortality of data through provisions, such as the right to be forgotten.”
Health Policy and Privacy Challenges Associated With Digital Technology, Grande D, Marti XL, Feuerstein-Simon R et al. JAMA Network Open, 2020.7.9
2020.7.9
“Researchers at the Urban Institute recently estimated that 25 to 43 million people in the US will lose their employer-sponsored insurance as a result of the coronavirus disease 2019 (COVID-19) pandemic. [..] The same Urban Institute study estimated that 6 to 10 million Americans will regain health insurance coverage through the Marketplaces.
[..] State policymakers in all states can take several additional steps to maximize the number of US residents who have newly lost insurance who regain health insurance coverage through the Marketplaces. Many of these steps can be taken with executive action.
[..] policymakers can minimize the administrative burden of Marketplace enrollment. All Marketplaces, state and federal, can continue to require only attestation instead of documentation for special enrollment periods, as an immediate, pragmatic step to reduce administrative burden. States can also take immediate action to ease enrollment by ordering state workers handling unemployment, Medicaid, and Supplemental Nutrition Assistance Program benefits to direct persons who are potentially eligible toward the Marketplaces. [..] For states using the federally facilitated Marketplace, this would involve directing applicants to healthcare.gov and enrollment resources if they are ineligible for Medicaid; Kentucky has recently implemented such an approach. State-based Marketplaces can go further by directly transitioning persons who are eligible to their Marketplaces. State-based Marketplaces should also redesign their front pages to clarify that, unlike Marketplace insurance, persons who are eligible can enroll in Medicaid throughout the year, because enrollment is always open. An innovative approach to be implemented later this year in Maryland will automatically enroll individuals who file taxes, do not have insurance, and are eligible into a low-cost Marketplace plan if they check a box on their state tax returns.
[..] state insurance commissioners should use their regulatory power to negotiate health plan premiums to maximize the affordability of Marketplace coverage. This does not simply involve minimizing premium levels, which only matter to the small number of those enrolling via the Marketplace who do not receive premium tax credits. For nearly all individuals enrolling via the Marketplace, who do receive premium tax credits, the affordability of Marketplace coverage is determined not by how low premiums are but by the difference in premiums between the silver benchmark plan with the second-lowest cost and other plans’ premiums. The premium tax credit structure caps the postsubsidy premium of the benchmark plan at a sliding-scale percentage of household income. Sufficiently large differences between the benchmark premium and plans priced at values less than the benchmark plan can and often do result in marketplace plans being free after applying subsidies. It is therefore desirable to maximize this difference to improve affordability for those enrolling via the Marketplace with premium tax credits and, at the same time, minimize overall premium levels for those enrolling without premium tax credits.
The most effective way that state insurance commissioners can maximize affordability for all enrollees is by instructing Marketplace insurers to silver switch their premiums. [..] Silver switching increases premium tax credits for enrollees who qualify by increasing the difference between the benchmark plan and other plans; it does not increase premiums for enrollees who do not qualify. Silver switching also has no effect on state budgets, because premium tax credits are paid by the federal government. Despite these clear advantages, only 30 states have implemented silver switching.”
Preparing the Health Insurance Marketplaces for the COVID-19 Recession, Anderson D and Drake Coleman. JAMA Health Forum, 2020.7.8
2020.7.8
“This year, clinicians will prescribe courses of oral corticosteroids to three quarters of patients with chronic inflammatory disorders and up to 17% of the general population. Most of these will be short “bursts” of 1 or 2 weeks, typically prescribed for common ailments like upper respiratory tract infections, bronchitis, skin rashes, and low back pain.
[..] Yao and colleagues are the first to our knowledge to report specifically on the potential harms of 14 or fewer days of oral corticosteroid exposure. In their retrospective analysis of 15 million patients in Taiwan’s National Health Insurance Program, the investigators evaluated the relationship between these brief exposures and 3 adverse events (AEs) associated with corticosteroids: gastrointestinal bleeding, sepsis, and heart failure. Twenty-five percent of the population received corticosteroids during the study period. Among these patients, mean age was 38 years, and 85% had no baseline comorbid conditions. More than half of corticosteroids were prescribed for acute contact dermatitis, rhinosinusitis, laryngitis, pharyngitis, bronchitis, or tonsillitis. Corticosteroid bursts were associated with significantly increased rates of all 3 AEs, despite a median exposure of just 3 days. Rate increases were highest 5 to 30 days after exposure but remained elevated after 3 months. Absolute risk differences were 10.3, 0.1, and 1.0 per 1000 patient-years for gastrointestinal bleeding, sepsis, and heart failure, respectively. These absolute risk increases were similar in patients with and without comorbid conditions, meaning that the potential for harm was not limited to persons at high risk for these AEs.
[..] it is useful to note the many parallels between use of corticosteroid bursts and that of other short-term medications, such as antibiotics and opiates. All of these treatments have well-defined indications but can cause net harm when used—as they frequently are—when evidence of benefit is low. Like those for antibiotics and opiates, prescribing patterns for corticosteroids vary widely and are greatly influenced by provider preference. We can thus conceive of a “corticosteroid stewardship” model of targeted interventions that aims to reduce inappropriate prescribing.”
Burst Case Scenario: Why Shorter May Not Be Any Better When It Comes to Corticosteroids, Wallace BI and Waljee AK. Ann Intern Med, 2020.7.7
“News emerged today that the company is planning to throw its weight around in another healthcare segment in need of an overhaul: insurance. A spokeswoman from the Bentonville, Arkansas retail behemoth confirmed that the company has created “Walmart Insurance Services LLC” to sell insurance policies. The business entity’s name was first filed with the Arkansas Secretary of State in late June.”
[..] It looks like the new subsidiary will be focused on selling Medicare Advantage plans, though the company was mum when asked for additional details. The spokeswoman’s statement about the “sale of insurance policies to our customers” also leaves open the possibility of Walmart expanding its services beyond senior shoppers in the future.
[..] Separately, on Tuesday, Walmart announced that it had struck a partnership with PBM startup Capital Rx, which provides health plans real-time information on prescription drug prices.
[..] Separately, on Tuesday, Walmart announced that it had struck a partnership with PBM startup Capital Rx, which provides health plans real-time information on prescription drug prices.”
Walmart confirms a new avatar — it’s also a health insurance agency, Reuter E. MedCityNews 2020.7.7
2020.7.7
“With many parts of the new [ONC] rule not taking effect for 24 to 36 months, it may be tempting to wait to begin comprehensive measurement. This would be a mistake. Monitoring change and improvement requires a baseline now, and course corrections require lead time. Measurement is also a prerequisite for successful enforcement, if necessary.”
Domain 1: Individual-level data access and use
- Behavior 1: Patients can access a full, structured, longitudinal set of electronic health information
- Measure to use now: percentage of unique patients provided timely access to their electronic health information (at least the structured common clinical data set) through an API conforming to certified health information technology (IT).
- Improved measure: percentage of unique individuals with timely access to their longitudinal health records across their providers, collecting at least three years of USCDI data along with other key data elements comprising the full designated record set.
- Behavior 2: Patients can contribute, or “write,” to their health record
- Measure to use now: whether certified EHR technology offers write access for patient-generated health data, and percentage of providers who have enabled at least one write API for patient-generated health data.
- Improved measure: percentage of unique patients for whom write access is available to contribute patient-generated health data, including but not limited to contributing standardized data elements in the USCDI, and the percentage of unique patients for whom such access is used for such purposes.
- Behavior 3: Dynamic, longitudinal shared care planning is accessible to patients, providers and non-clinical caregivers
- Measure to use now: percentage of transitions of care and referrals in which a summary-of-care record was created conforming to certified EHR technology and electronically exchanged using a certified API.
- Improved measure: percentage of unique patients for whom a dynamic, longitudinal shared care plan is available, and the percentage of unique patients for whom such a care plan is used.
- Behavior 4: Robust third-party app ecosystem available and used
- Measure to use now: the number of discrete, third-party EHR-connected apps that are available, the number of such apps that are used by patients, and the number that are used by providers.
- Improved measure: percentage of providers and health systems that actively use third-party apps with EHR APIs; percentage of potential UCSDI data elements that are available in certified EHR technology for third-party app development, and the percentage of such data elements that are used for such purposes.
Domain 2: Bulk-data access
- Behavior 5: Use of bulk-data APIs to advance population and public health
- Measure to use now: whether certified EHR technology products offer any API for bulk data transfer, and whether providers have enabled such capability.
- Improved measure: percentage of providers that use a FHIR bulk transfer API for specified purposes, such as direct electronic clinical quality measure reporting or reporting to state or federal public health agencies.
Domain 3: Information Blocking
- Behavior 6: No information blocking occurs
- Measure to use now: number of reports (allegations) of information blocking on the ONC’s website, by actor, along with statistics about any determinations regarding those complaints.
- Improved measure: reports of how often specific behaviors are observed by health IT developers, health care providers, health information networks, certified API developers, API users, API information sources, and others in a position to observe and report information blocking.
We cannot evaluate and improve what we do not measure. The ONC’s new regulations take significant steps toward interoperability, but there are many ways in which long-term policy goals and desired behaviors might still not materialize. Without near-term proxy measures now and more robust, improved measures soon, we risk stumbling forward in the dark, with no clear indicators of whether the ecosystem we are building provides seamless and secure access, exchange, and use of health data when and where needed. Beginning measurement now is critical to establish baselines, assess progress toward the new regulatory minimums, and highlight the gaps we must address to achieve broader national needs and goals.”
Measure The Impact Of The ONC’s New Interoperability Rules Now, Savage M, Neinstein A and Adler-Milstein J. Health Affairs Blog. 2020.7.7
“The Medicaid Drug Rebate Program has been in place since 1991. By agreeing to cover every drug a company sells no matter its price, Medicaid programs give up most of their negotiating leverage. But by being guaranteed access to prices other purchasers pay—such as large health systems and drug wholesalers—Medicaid programs are assured that at least they will pay no more than the best free market price that pharmaceutical companies have shown they are willing to accept in the US. Philosophically, the agreement seeks to harmonize two conflicting goals: ensuring access to any beneficial therapy for our nation’s neediest residents while achieving affordability in a program that (inclusive of the Children’s Health Insurance Program) serves more than 70 million of our nation’s neediest individuals, half of whom are children.
[..] As for contracts depending on outcomes-based measures, they are routinely touted by the industry as the salvation for high drug prices, even though the approach has at least four foundational defects.
- Outcomes-based agreements cannot scale. [..] A recent review of Italy’s experience with these arrangements found that pursuing the approach at a national scale still produced only a “trifling refund.” The US experience has been no better, with Steve Miller, the chief clinical officer of Cigna suggesting that these agreements tend to “collapse under their own weight.” Michael Sherman, the chief medical officer of Harvard Pilgrim Health Care listed a number of challenges that impede scaling the agreements, including that they are “difficult to negotiate and carry out, many drugs don’t have readily measurable outcomes through claims data, and patients may switch plans before longer-term results can be assessed.”
- Outcomes-based agreements shift the risk and cost of drug performance assessment. [..] While traditionally, a manufacturer would invest to reduce this concern by conducting more robust clinical studies prior to setting a launch price, it is apparent why the drug industry favors the outcomes contracting approach. If a high price is available for treatments based on the expected rather than documented benefit, why not take it? The drug company can spend less money evaluating its product prior to launching it and get to market and revenue sooner. If the product performs as expected, the company ends up capturing the same price as it would have anyway. As one analogy for how these contracts work in favor of the companies, it is like a car dealership charging you for the gas when you test drive the car it is trying to sell you.
- Outcomes-based agreements do not necessarily result in prices aligned with value. Contracts in which refunds are given when treatments underperform could, in theory, result in alignment of price with therapeutic value after the fact. However, there is little reason to believe this outcome will be arrived at reliably. Most of the existing agreements are confidential, but the ones that have been analyzed include fundamental defects that keep the ultimate net price well above one commensurate with the observed treatment value.
- Outcomes-based agreements are fundamentally human subjects research without safeguards or benefits.
[The author proposes the following modifications:]
- Eliminate any provision that would allow contracts based on existing evidence of effectiveness to be exempt from Medicaid best price.
- Clarify that the lowest price arising from each individual outcomes agreement is the Medicaid best price, available to all Medicaid programs without participation on the same contractual terms. [..] If refunds are delayed due to long time horizons of evaluation, interest should accrue based on the statutory late payment penalty rate. [..]
- Articulate that outcomes-based contracts in which patient outcomes are tracked for the purpose of payment reconciliation are human subjects research. [..]
- Indicate that if any Medicaid program wishes to engage in any available market contract, it should be able to, under the same terms.
CMS’s Proposed Medicaid Best Price Loophole for Value-Based Purchasing Of Drugs, Bach PB. Health Affairs Blog, 2020.7.6
“In this study, we sought to characterize patterns of care for the top 5% of the highest-risk patients enrolled in the VHA [Veterans Health Administration] nationally based on a predictive risk score for near-term hospitalization that is generated for all VHA patients. [..] We aimed to compare (1) primary care encounters (face-to-face, telephone, and secure messages) among high-risk vs low-risk patients, (2) the proportions of high-risk patients assigned to general vs specialized primary care, and (3) the use of primary care and medical (nonsurgical) specialty care visits among high-risk patients assigned to general vs specialized primary care.
[Methods] The VHA calculates Care Assessment Needs (CAN) scores weekly for all enrolled veterans who are assigned to any (general or specialized) primary care practitioner and are not hospitalized at the time of CAN score generation. We used an updated CAN model to assess hospitalization risk using VHA administrative data on demographics, use of VHA health services, comorbidity indicators, prescribed medications, vital signs, and veteran-specific variables. The top 5% of patients identified by CAN score have an almost 20% risk of VHA hospitalization within the following 90 days.
We defined the high-risk patient cohort as all patients with a CAN score in the 95th or greater percentile at any time during April 1, 2015, through September 30, 2015 (n = 351,012). We excluded patients who had died during this period for the purpose of assigning a CAN score. We defined the remainder of patients (n = 3,958,180) as low risk. We used the first date that a patient qualified as high risk and the last date (ie, September 30, 2015) for low-risk patients as the index dates for our analyses.
[Results] Compared with low-risk patients (n = 3,958,180), high-risk patients (n = 351,012) had 2.5 times the face-to-face, 4 times the telephone, and twice the number of secure messaging encounters in primary care during the year before being identified as being high risk for hospitalization. Based on the CAN score, which includes rates of acute care use,33 high-risk patients had substantially more mean hospital visits (0.8 [1.1] vs 0.02 [0.2], P < .001) and emergency department visits (2.1 [2.6] vs 0.2 [0.7], P < .001) per year than low-risk patients during the same period.
[..] most high-risk patients (308,433 of 351,012 [88%]) were assigned to general care than to specialized primary care. Of the remaining high-risk patients, 5% were assigned to women’s health, 2% to geriatrics, 2% to home-based primary care, 0.8% to homelessness primary care, 0.8% to HIV care, 0.8% to spinal cord injury care, 0.2% to dialysis, and 0.9% to all other specialized primary care settings.
[..] few high-risk patients used add-on services for intensifying primary care. Among the 351,012 high-risk patients in our study, 10.9% (38,354) received telehealth monitoring for chronic conditions (eg, hypertension and diabetes), 6.8% (23 827) received housing services, 4.1% (14,545) received palliative care or hospice, and 1.6% (5620) received intensive mental health case management. Different specialized primary care settings, however, used these add-on services at different rates. For example, 4.5% (124 of 2775) of homeless primary care high-risk patients received telehealth services, whereas 53.5% (1484 of 2775) received housing services. In contrast, 15.9% (1291 of 8139) of home-based primary care high-risk patients received telehealth services, whereas 0.7% (70 of 8139) received housing services.
[Discussion] High-risk patients in the VHA are a small fraction of the general population but account for nearly half of overall health care costs, most of which are accounted for by hospitalizations. Contrary to expectations, we found that most high-risk veterans (88%) were assigned to general primary care rather than specialized primary care. Patients assigned to general primary care had more mental health and primary care visits than medical specialty visits. High-risk patients used all types of encounters, including in-person, telephone, and secure messaging, at higher rates than low-risk patients.”
Use of General Primary Care, Specialized Primary Care, and Other Veterans Affairs Services Among High-Risk Veterans, Chang ET, Zulman DM, Nelson KM et al., JAMA Network Open 2020.6.29
2020.7.1
“we argue that, conceptually, the main advantage of subscription models over traditional prescription drug payment arrangements is that they could reduce some sources of uncertainty in spending for payers and in revenue for manufacturers. But compared with traditional prescription drug payment arrangements, the ability of subscription models to lower prescription drug spending is limited.
[..] The defining feature of a subscription model is a negotiated fixed amount paid by a payer to a manufacturer in exchange for access to one or more specific drugs for a specific patient population and use over a predefined period.
[..] for drugs covered by Medicaid, manufacturers participating in the Medicaid Drug Rebate Program are required to pay a rebate to Medicaid programs that is equal to the greater of 23.1 percent of the average manufacturer price or the difference between the average manufacturer price and the best price—the lowest unit price at which manufacturers sell a drug to commercial payers. In return, Medicaid programs are obligated to cover all the drugs produced by participating manufacturers and approved by the FDA. Most states negotiate with drug manufacturers to obtain supplemental rebates, in some cases by forming a multistate purchasing pool, but they are not allowed to use closed formularies unless they withdraw from the Medicaid Drug Rebate Program completely.
Medicare Part D prescription drug plans are not subject to the Medicaid best-price rule but are required to cover at least two chemically distinct drugs in each nonprotected therapeutic category or class. In an effort to ensure broad access among Medicare beneficiaries, all of the FDA-approved drugs in six protected therapeutic classes are required to be covered by these prescription drug plans: immunosuppressants, antidepressants, antipsychotics, anticonvulsants, antiretrovirals, and antineoplastics. For private payers, the Medicaid best-price rule essentially creates a f loor on how much pricing discount manufacturers can offer to commercial payers; a low unit price may trigger more rebates to Medicaid programs.
[..] Subscription models mitigate these risks for both parties by setting a fixed payment up front, therefore trading one risk (substantial spending for payers or risk of little revenue for manufacturers) for another (misestimating patient utilization when setting the fixed payment amount). A fixed payment under subscription models offers the complete certainty that reduces risks to both parties: Manufacturers are guaranteed the negotiated level of revenue, while payer spending is capped. Subscription models, however, are not able to resolve the payment or revenue risk completely. The remaining risk appears in a different form: Both parties may misestimate volume and effectively over- or underpay relative to what they likely would have paid under the traditional payment approach. More specifically,
- The payer may pay more per treatment under a subscription model than it would have otherwise if the volume of the drug used by patients is lower than what was expected under a traditional payment arrangement.
- The manufacturer may receive less payment per treatment under a subscription model than it would have otherwise if the volume of the drug used by patients is higher than what was expected under a traditional payment arrangement.
[..] If there is no uncertainty in patient utilization and both parties know exactly how much of a drug will be used, a subscription model does not have an advantage over a traditional approach (i.e., a closed formulary). As a result, absent other such factors as public relations or marketing that might favor a subscription model, there is no difference in the total payment or price per treatment between the two approaches.
[..] A subscription model could potentially generate three major benefits for Louisiana and Washington:
- Payers and patients could better afford prescription drugs that would otherwise impose a larger budgetary impact (affordability),
- patient access is potentially broadened, and
- there is increased certainty with regard to payer spending and manufacturer revenue.
Importantly, a subscription model allows the states to selectively cover a subset of prescription drugs available, which is not feasible without special regulatory approval because of the Medicaid Drug Rebate Program, and such selective coverage of prescriptions is associated with the first two potential benefits.
[..] Why is the expected unit price so low in Louisiana’s case? Theoretically, as we discussed in the previous section, we would expect traditional payment arrangements, such as a closed formulary, to achieve similar price discounts. The discrepancy can largely be explained by regulatory constraints: Medicaid programs are not allowed to use closed formularies because their participation in the Medicaid Drug Rebate Program requires them to cover all FDA-approved drugs of participating manufacturers. But both Louisiana and Washington have obtained approval from the Centers for Medicare and Medicaid Services (CMS), which oversees Medicaid programs at the federal level, to use the subscription model to contract with only one manufacturer for one product—essentially a closed formulary.
As a result, the state has much more leverage in negotiation with manufacturers, which largely explains the price decline from $31,818 to $5,645 per treatment. To circumvent barriers to price negotiation imposed by the Medicaid Drug Rebate Program, the state of Louisiana appears to have turned to a subscription model to obtain a low expected unit price for hepatitis C treatment.
[..] In a market without price-negotiation constraints, significant uncertainty around patient utilization is required so that subscription models are advantageous over traditional payment approaches. In addition, the following two conditions are likely needed to ensure that price negotiations between payers and manufacturers can generate sufficient economic benefits to offset subscription contract implementation costs. First, payers need to cover a pharmaceutical therapy expected to generate a large spending increase. And second, payers control a sizable market and/or there are two or more manufacturers producing products that can be substituted for each other. The first condition indicates a large gap between patient needs and the spending payers can afford, and the second condition enables payers to negotiate an affordable price. Prescription drugs that align with these two conditions and are associated with significant uncertainty in patient utilization are potential candidates for subscription models.”
Subscription Models for Prescription Drugs: The Motivation, Potential and Limitations of a New Payment Model, Liu HA, Mulcahy AW and Rose AJ. RAND Corporation Perspective, May 2020.
2020.6.26
“In 2017, approximately 1.6 million patients receiving Medicare fee-for-service benefits were admitted to a SNF [skilled nursing facility], with an estimated annual cost of $28.4 billion, and 3.4 million patients received HHA [home health agency] services at a cost of $17.7 billion.
[..] Historically, SNFs and HHAs have been paid largely based on the amount of therapy provided, rather than the level of illness or special care needs of patients. These payments were constant across the entire duration of SNF or HHA care as long as the amount of therapy provided was the same, regardless of whether a patient’s functional status or other needs changed.
The historical system created strong incentives to maximize the number of SNF days or HHA episodes and also provide additional therapy to qualify for a higher payment. Recognizing this, the US Centers for Medicare & Medicaid Services recently implemented the Patient Driven Payment Model for SNFs and the Patient-Driven Groupings Model for HHAs.
[..] The new SNF payment model, which began in October 2019, bases payment on a variety of patient characteristics, including the clinical condition requiring SNF care, functional status, speech and language pathology, need for specialized nursing care, and a general illness severity score. It retains per-diem payments, but they are higher for early days in the stay and adjusted downward later.
The new HHA payment model started in January 2020 and shifted the length of the HHA payment episode from 60 to 30 days. Payments are adjusted for patient characteristics, including whether HHA services were preceded by a hospitalization or SNF stay, the primary reason for HHA care, the patient’s functional status, and the presence of comorbid conditions. The first 30-day period is paid at a higher rate than subsequent 30-day periods, periods with low use receive a smaller payment, and exceptionally high-cost cases receive an outlier payment.
[..] Because the new SNF and HHA payment models base payments on patient characteristics rather than the delivery of therapy, the net outcome is that SNFs and HHAs that care for patients with more severe illness or clinical problems will receive more dollars and those that care for patients in better health who can tolerate high levels of therapy will receive fewer dollars.
[..] First, it [Centers for Medicare & Medicaid Services] should carefully analyze the self-reported functional and cognitive assessments by SNFs and HHAs. Substantial prior work calls into question the reliability of these assessments. For example, when patients switch between settings of care, such as from SNF to HHA, the functional and cognitive assessments frequently do not match, suggesting that SNFs and HHAs code patients more intensively as a means to get higher payments. Medicare has recognized this; thus, the new HHA payment model includes a 4.36% downward adjustment in payments to account for these behaviors and avoid increases in overall HHA payments. Although progress has been made in harmonizing measures across postacute settings, analyzing their consistency as patients transfer settings will be a continually important litmus test of data accuracy.
[..] Second, Medicare should monitor for changes in the types of patients admitted to SNFs and HHAs, because both new payment models may incentivize them to avoid or underprovide therapy services to those who are less medically complex but require intensive therapy (eg, postsurgical rehabilitation). While quality measures would ideally help identify underprovision of therapy, it is unclear whether measures that are independent of SNF and HHA reporting, such as hospital readmissions, will be sensitive to the amount of therapy provided. This is a critical gap, because publicly reported quality measures on Nursing Home Compare or Home Health Compare are primarily collected from self-reported data by SNFs and HHAs, and the only measure in the SNF value-based purchasing program is a hospital readmission measure.”
Will Medicare’s New Patient-Driven Postacute Care Payment System Be a Step Forward?, Navathe AS, Grabowski D. JAMA Health Forum, 2020.6.23
2020.6.25
“Although substantial numbers of primary care physicians are employed by hospitals or health systems, over half of the roughly 220,000 primary care physicians nationally continue to operate within the community as full or part owners of independent small practices. In contrast to hospitals or health systems, these practices lack ready access to capital or sufficient financial reserves that would be required to provide a base of support in the absence of ongoing revenue. In addition, according to data from the Medical Group Management Association, the average primary care practice supports four support staff (including clinical and office staff) at a cost of well over $200,000 per year and other operating costs of similar magnitude per full time equivalent physician, and the ability of practices to support such operations in the current environment is unclear. Finally, over 25% of practicing primary care physicians are age 60 and older and disruptions such as we are seeing in current practice could lead to higher rates of retirement, which would compound already existing shortages of primary care.
[..] Our data show that the percent change in visit volume in the context of COVID-19 was at its low point in late-March for all types of visits (down 58 percent) and early-April for in-person visits (down 69 percent) and that the rebound would be expected to reach a steady state in mid-June (although still below normal). Based on this change in visit volume in the context of COVID-19, we estimate that primary care practices over the course of calendar year 2020 would be expected to lose $67,774 in gross revenue per full time physician due to the effect of COVID-19 on fee-for-service payments (interquartile range [IQR]: –$80,557, –$54,990; the difference between 2020 gross revenue with COVID-19 of $474,416 and the anticipated gross revenue if COVID-19 had not occurred of $542,190). The loss in gross revenue would result in calendar year 2020 net revenue (gross revenue minus total practice costs) of –$57,190 (IQR: –$265,636, +$119,803) per full time physician if practices maintained their pre-existing costs. The interquartile ranges cross zero, implying that some practices would incur debt (negative net revenue) while others may maintain some positive net revenue. By contrast, the loss in gross revenue would result in net revenue of -$28,265 per full time physician (IQR: –$205,503, +$127,034) if practices furloughed staff and reduced salary and benefit costs to the 25th percentile of staffing levels during the time period shelter in place was in effect (noting that in our simulation, furloughs reduce the practices’ operating loss but not revenue). We modeled that the lowest levels of revenue would be expected in the month of April 2020, during which gross revenue would be expected to be a weighted average of $26,601 lower than usual per full time physician over the course of the month (a 58.9% loss; IQR: –$31,619, –$21,584) from the baseline of $45,182.
[..] Alternative Scenarios
First, we estimated the impact of a second shelter-in-place during November and December 2020, having half as much impact on visit volume as the prior shelter-in-place. Under this scenario, primary care practices over the course of calendar year 2020 would be expected to lose $85,666 in gross revenue (IQR: –$101,824, –$69,507), resulting in net revenues of –$75,082 (IQR: –$280,153, $98,536) if practices maintained their pre-existing costs, or –$46,157 (IQR: –$220,020, $105,767) if practices furloughed staff and reduced salary and benefit costs to the 25th percentile of non-physician staffing levels. Given the number of active primary care physicians (N = 223,125), we estimated that the cost would be $19.1 billion (IQR: $15.5 billion, $22.7 billion) at a national level to neutralize the gross revenue losses caused by COVID-19 among primary care practices, without subjecting staff to furloughs.
Second, we simulated what capitated payment level would be required to enable practices to have no net revenue loss for calendar year 2020 at the projected levels of visit volume and telemedicine uptake. We estimated that beyond fee-for-service payments, practices would require an incremental global capitated payment of $3.27 per member per month (IQR: $2.70, $4.77) to neutralize their gross revenue losses due to COVID-19 during the calendar year 2020, or, to fully replace usual FFS gross revenue regardless of COVID-19 with a capitated payment, would require a payment of $26.19 PMPM (IQR: $21.57, $38.19). Due to differences in patient populations and payer mixes, this varied from $18.55 PMPM for FQHCs (IQR: $13.83, $33.89) to $30.82 PMPM for non-FQHC urban practices in high-poverty zones (IQR: $28.44, $36.62).
[..] Fifth, we recomputed the outcomes with practices re-stratified by practice size, in terms of the number of FTE physicians in the practice. We observed higher gross revenue losses among smaller practices with three or fewer full-time physician equivalents than among larger practices, due to a higher proportion of commercially- and Medicaid-insured to Medicare-insured patients and the delays and variability among commercial and Medicaid payers in paying for telemedicine at in-person rates ($78,053 lost gross revenue if three or fewer full-time physicians, versus $64,481 among those with four to six, and $60,788 for those seven or larger, on average).
[..] Why should we care about primary care in particular when so many areas of the economy are being similarly impacted? [..] We think primary care is different for several reasons. First, after COVID-19 recedes, the US will continue facing the challenge of caring for the 100 million or more adults with diabetes or pre-diabetes, and hundreds of millions with obesity, just to name a few conditions, particularly given the fact that over 60% of visits nationally for such chronic conditions are delivered in the primary care setting. Second, a well-functioning primary care system is needed to serve as the “first contact” entry point to the health care system and to determine if and when patients require specialist or emergency care. Absent such a system, patients will be forced to rely even more heavily on emergency rooms and, in some cases, direct access to specialists, both of which could result in unnecessary care and expenses, potentially far in excess of the above estimates, that might otherwise have been averted. Third, accumulating evidence suggests that primary care is good for the health and quality of care of Americans. Areas of the country with increasing levels of primary care capacity saw improvements in life expectancy and patients who use primary care have been shown to receive substantially higher quality care, including increased provision of recommended preventive and chronic disease services. A health care system without the necessary primary care infrastructure therefore is likely to be increasingly fragmented, more costly, and less effective, and these costs will be borne by all Americans. Independent practices in high-poverty areas may be particularly vulnerable to closure and an important target for financial interventions. There is potential for practice closures to exacerbate existing disparities in care given the types of practices that are most at risk and where they are located. Our results ultimately highlight vulnerability of primary care practices to financial demise due to fee-for-service and visit-based payment policies, indicating that capitation-based payment reforms may be key to ensuring robustness of primary care into the future. Relatively small capitated payments from payers, employers or government could be used to mitigate losses and to keep practices from closing.”
Primary Care Practice Finances In The United States Amid The COVID-19 Pandemic, Basu S, Phillips RS, Phillips R et al. Health Affairs, published online 2020.6.25
2020.6.24
“Recent work reports that premature mortality from these causes occurs not only among middle-aged white adults but also among young adults and additional racial/ethnic groups. This reversal of US life-expectancy improvements was coined deaths of despair and has raised public and scientific interest. Studies on deaths of despair have not measured the central empirical claim that despair is a shared risk pathway to suicides and alcohol- and drug-related deaths or their precursors: suicidal behaviors and thoughts, alcohol misuse and dependence, and illicit drug use (ie, the “diseases of despair”). To our knowledge, to date, despair has not been studied as an independent construct in and of itself.
Despair is defined as “a state of mind in which there is an entire want of hope.” From a psychological perspective, this definition focuses on a cognitive state that includes defeat, guilt, worthlessness, learned helplessness, pessimism, and limited positive expectations for the future. [..] We use data from a prospective, longitudinal, community-representative study of more than 25 years conducted in a rural area of the Southeastern United States. The sample was recruited from parts of the Appalachian region, which has had particularly high levels of premature mortality and deaths of despair, including from opiate overdoses.
[..] Three cohorts of children, aged 9, 11, and 13 years, were recruited from a pool of approximately 12,000 children using a 2-stage sampling design, resulting in 1420 participants. [..] Annual assessments of the 1420 children were completed during the period from 9 to 16 years of age (6674 total observations; 1993-2000) and then again at 19, 21, 25, and 30 years of age (4556 observations of 1336 participants; 1999-2015), for a total of 11,230 total assessments.
[..] Seven items of the Child and Adolescent Psychiatric Assessment and YAPA [Young Adult Psychiatric Assessment] interviews capture the cognitive features of despair: loneliness, hopelessness, feeling unloved, helplessness, low self-esteem, frequent worries, and feeling sorry for oneself. [..] Two items used in the despair scale are criteria for DSM-defined persistent depressive disorder or dysthymia (ie, a pattern of dysphoria lasting more than 2 years), 1 item is a criterion for major depressive disorder, 1 item is a criterion for generalized anxiety disorder, and 3 items are not criteria for any psychiatric disorder. The 7 dichotomous despair indicators were summed into a despair score. The internal consistency of this scale was acceptable (Cronbach α = .73). This scale was winsorized at 3 or more indicators of despair to aid in the presentation of results. [..] Despair may also occur in the emotional (eg, sadness and anhedonia), behavioral (eg, reckless and high-risk behaviors), and biological (eg, signs of biological depletion such as high allostatic load) domains, but these domains were not the focus of the present study.
[..] The prevalence of despair was between 5% and 1% in childhood and adolescence (9-21 years) but increased to around 20% in young adulthood (between 25 and 30 years). Levels of any despair and total despair scores increased by age.
[..] The 3-month weighted prevalence of any despair was 19.5% (476 of 2424 observations) and was 7.6% (201 of 2424 observations) for reporting 2 or more items. Despair scores did not differ between male and female participants. Levels of despair differed by race/ethnicity; compared with white participants, African American participants reported much higher rates of despair and Native American participants reported lower levels of despair. Lower educational level and falling below the federal poverty line were associated with higher levels of despair.
[..] Despair was associated with a diagnosis of a DSM depressive disorder (odds ratio [OR], 3.8; 95% CI, 2.9-4.9; P < .001). Of the 476 young adult observations in which at least 1 symptom of despair was reported, however, 94 (19.7%) of them met criteria for a DSM depressive disorder, suggesting that despair encompasses a much broader group than those with depression.
[..] ORs represent the change in odds of the outcome given a 1-unit increase in the despair score (range, 0-3). [..] In the model adjusted for depressive disorder (Table 3), lagged despair was still associated with suicidal thoughts and behaviors (OR, 1.5; 95% CI, 1.1-2.1), illicit drug use (OR, 1.7; 95% CI, 1.1-2.8), and opioid use (OR, 1.9; 95% CI, 1.0-3.5).
[..] alternative definitions of long-term despair exposure: (1) total despair scores across all prior observations (cumulative despair levels) and (2) total observations reporting any despair (cumulative despair observations). [..] Both measures of long-term despair were associated with increased risk for suicide (cumulative despair levels: OR, 2.6; 95% CI, 1.5-4.7; cumulative despair observations: OR, 10.7; 95% CI, 3.5-32.9), illicit drug use (cumulative despair levels: OR, 2.5; 95% CI, 1.3-5.0; cumulative despair observations: OR, 6.0; 95% CI, 1.6-22.9), illicit drug use disorder (cumulative despair levels: OR, 2.3; 95% CI, 1.3-4.4; cumulative despair observations: OR, 9.4; 95% CI, 2.4-36.7), and opioid use (cumulative despair levels: OR, 3.3; 95% CI, 1.4-7.7; cumulative despair observations: OR, 7.5; 95% CI, 0.9-65.5). In all cases, the associations were stronger than those observed in the lagged models, suggesting the importance of indexing long-term despair exposure.
[..] In this analysis, which tested a limited number of outcomes, the associations of despair were specific to suicidal behavior, illicit drug use, illicit drug use disorder, and opioid use. These findings are consistent with evidence from other studies that suggest that suicidal behavior and drug use are a result of diminished valuing of oneself and one’s future. Despair was not associated with alcohol use disorder, however. Alcohol use disorder was equally common among those with the lowest levels of despair as in those with the highest levels of despair. This study does not support alcohol use disorder as a disease of despair.
[..] despair was more common among those with low educational level or limited financial resources. At the same time, the associations of despair with outcomes were neither stronger nor weaker in specific sociodemographic groups. In other words, the relative associations of despair with outcomes did not differ systematically between groups. This finding is consistent with recent reports that the newest premature mortality trends appear to be mostly universal across US racial/ethnic groups. Accordingly, public policy strategies should focus on population-level interventions rather than targeting specific subgroups to reduce despair.
[..] the public health outcome of the disability-adjusted life-years associated with despair may far outstrip the association with mortality itself. Future studies should not only focus on outcomes associated with mortality but also explore how despair is associated with important areas of life functioning, such as financial and social functioning and physical health.”
Associations of Despair With Suicidality and Substance Misuse Among Young Adults, Copeland WE, Gaydosh L, Hill SN et al. JAMA Network Open, 2020.6.23
“We are not the first to sound alarm bells about the role of platforms in facilitating the public-health response to COVID-19. But most critics have focused narrowly on classic privacy concerns about data leakage and mission creep—especially the risk of improper government access to and use of sensitive data. Apple and Google released an application programming interface (API) to enable apps for proximity tracing and exposure notification tailored to address those criticisms. But that approach fails to address more fundamental obstacles to creating a safe and sustainable system of public-health surveillance, and it also creates new obstacles.
[..] the mission creep problem: the risk that government authorities will adapt automated tools originally intended for contact tracing to enforce quarantine and stay-at-home compliance, as occurred with China’s Alipay Health Code. Many might assume that an automated system designed to restrict the mobility of thousands or even millions of people would only exist in authoritarian countries. But its major components already exist here, too. Consider Google’s community mobility tool, which uses aggregated geolocation data (collected via “advertising identifiers”) to show mobility patterns within communities. Google didn’t need to do much to design that tool because fine-grained geolocation data is at the heart of the ad-based business model. If Google wanted to develop a community mobility app similar to Alipay Health Code to push out to people’s phones, it could easily do so using the granular data about individual mobility that it already has.
[..] The law that protects health information privacy and security, HIPAA, permits disclosure of protected health information to public-health authorities for specified public-health purposes. That’s entirely appropriate, but there is no corresponding law prescribing privacy practices for data collected in the emergency public-health context. Ostensibly, the federal Privacy Act of 1974 and corresponding state laws govern data collection for public-health surveillance, but those laws include broad exceptions for law enforcement activities, and they don’t apply to records collected and maintained by private entities.
[..] We think the focus on data leakage and mission creep misses the forest for the trees. We see three major problems arising from uncritical deference to insufficiently regulated platforms—problems that the Apple/Google API doesn’t begin to solve.
1. Deference to private-sector solutions lets tech firms identify and define the values at stake.
[..] Privacy is about more than just anonymity or informational self-determination, but you wouldn’t know that by looking at the design specs of the Apple/Google API. [..] “I agree” buttons that secure our consent and the “opt-in” toggle buttons meant to give us choices about and notice of data practices. But consent is a dubious way to justify data practices and control is a narrow way to think about privacy.
[..] public-health surveillance needs to be comprehensive, not opt-in. In a democracy, comprehensive public-health surveillance requires public trust. That’s why countries with stronger data privacy laws provide exceptions allowing public-health surveillance, but then adopt public-health surveillance laws with separate, custom-designed privacy provisions designed to keep collected data siloed and secure. Such laws also typically include limits on data retention—provisions requiring the destruction of public-health surveillance records after the emergency public-health need to retain them no longer exists. [..]
2. Deference to private-sector solutions can ignore or exacerbate preexisting patterns of inequity.
[..] communities frequently targeted by police or immigration enforcement have good reason to be wary of the government and of government uses of data. Immigration and Customs Enforcement in the United States, for example, has purchased commercially available cellphone location data for its enforcement purposes. A 2019 Pew Research Center report found that 56 percent of white Americans are concerned what law enforcement knows about them, but among Hispanic and black respondents that figure is 67 percent and 73 percent, respectively. That distrust could undermine adoption of digital contact-tracing technology. [..]
3. Deference to private-sector solutions ignores tech’s role in driving public polarization and amplifying the misinformation and disinformation that undermine public-health efforts.
[Two recommendations]
- We cannot effectively respond to the pandemic by haphazardly privatizing essential functions of public institutions. Right now, governments and tech firms seem to have different goals, strategies, and understandings (or misunderstandings) of key values. What is needed is collaboration around human-centered public-health surveillance, which requires strong data protection mandated by law and extending into emergency response systems.
- Effective pandemic response also requires regulating the platform business model. [..] most disinformation flows virally and consensually, circulated within affinity groups and networks and amplified by design decisions that elevate controversy and outrage because it is profitable, and most disinformation originates outside the clearly defined domains of political advertising. Behavioral surveillance and targeted amplification are forms of manipulation akin to many other practices that consumer protection laws already prohibit, and they also represent a large-scale assault on the institutions and knowledge structure of a stable democracy.
The dangers of tech-driven solutions to COVID-19, Cohen JE, Hartzog W and Moy L. Brookings Tech Stream, 2020.6.17
2020.6.23
“Whether the shift to alternative payment models has been a success or failure is a matter of intense debate with substantial implications for future policy directions. Yet there is a paradox. Individual demonstration projects have not reported significant success. However, overall health care spending as a share of gross domestic product (GDP) has plateaued at just less than 18%, below the 20% predicted by the US Department of Health and Human Services (HHS) Office of the Actuary and the Congressional Budget Office (CBO). This in part may reflect that the economy has expanded at a rate faster than predicted. Nevertheless, the flattening of real per capita Medicare expenditures since the passage of the ACA is evidence of cost control.
[..] at least 3 main factors help to explain why these individual model evaluations may underestimate the true effects of alternative payment models on health spending.
First is psychological change among clinicians and health care organizations. [..] Anticipation of ACA-driven expansion of value-based payment may have catalyzed a change in psychology and approach among clinicians and health care entities, and produced practice pattern changes and efficiency gains that decreased spending regardless of alternative payment model participation.
Second is peer network effects. When a clinician’s or health care organization’s neighboring practitioners or medical centers practice differently, they may be influenced by this other behavior. Clinicians and health care organizations observing colleagues or peer organizations engaging in novel, value-oriented behavior may pursue similar efforts.
[..] Third is control group contamination. Because the CMMI has implemented a large number of models in a short period, it has become practically impossible to ascertain the influence of any single model. Although formal accounting of the degree of contamination across dozens of programs is not yet available, it is likely to be large, supported by reports that more than 350 000 clinicians were exempt from MIPS (Merit-based Incentive Payment System) because of participation in alternative payment models.
[..] Assessment of peer-reviewed, systematic evaluations of prominent alternative payment model programs that reported Medicare spending trends reveals patterns in the control group spending trend. Despite expectations of an increase in spending based on CBO and HHS projections, there was a consistent “bending of trend,” reflecting slowing of spending growth or actual spending declines in the control group for 7 of 8 studies evaluated.
[..] possible explanation is that financial uncertainty from changes in the US economy led patients to use less health care. However, this is not supported by the evidence, which indicates that Medicare patients have not reduced their demand for health services. As a further possible explanation, perhaps Medicare payment reductions explain the observed declines in spending. Yet a 2012 CBO analysis projected that savings from these reductions would be $35 billion annually, approximately 1% of national health expenditures. A 2014 Kaiser Family Foundation analysis concluded that a large portion (38%) of the gap between projected and realized spending remained unexplained after accounting for CBO projected savings from the ACA, payment reductions in the Budget Control Act of 2011, the slowing of prescription drug price growth, and other policy changes. Payment reductions alone cannot explain the gap.”
Alternative Payment Models—Victims of Their Own Success?, Navathe AS, Boyle CW and Emanuel E. JAMA 2020.6.22
2020.6.19
“In the era of COVID-19, a reactive, ad hoc approach to symptom assessment is no longer acceptable. Well-organized pandemic responses demand a more proactive, systematic, and universal approach, in which all individuals are offered regular, remote symptom checks, customized to their individual needs and conditions. Such capabilities would provide a continuous link between patients and their clinicians during public health emergencies such as COVID-19 and would also have long-term payoffs during routine care for triaging acute issues and monitoring chronic conditions.
[..] A system for symptom monitoring should have six characteristics. First, it should build upon existing relationships between patients and clinicians. Feasibility studies have shown that when symptom monitoring is integrated into care, adherence and retention rates are substantially higher compared with programs disconnected from established care. [..] For patients who don’t have a regular primary care provider, health systems, government agencies, and payers might offer this service directly to patients.
Second, the benefits to patients of symptom monitoring must outweigh the burdens. Recent studies of between-visit symptom monitoring interventions for asthma and rheumatoid arthritis used brief patient-reported outcome questionnaires administered via smartphone app. Benefits cited by patients included greater awareness of their chronic disease, feeling more connected to their physician, faster access to care when they needed it, and preventing exacerbations and emergency department visits.
[..] Third, symptom monitoring needs to be tailored to the patient.
[..] Fourth, a symptom monitoring program must be standardized as much as possible, including using common clinical protocols, technical standards, and validated patient-reported outcome measures.
Fifth, patients should be able to report symptoms through multiple modes depending on their clinical needs and technical capabilities. Smartphone apps can be highly effective because of the ability to develop interactive and engaging features, and they are used by more than 80 percent of the US population. But effective monitoring can also occur via text message, interactive voice response technology, or voice assistants on patients’ personal devices (for example, Siri and Alexa).
[..] Finally, symptom monitoring programs must accommodate frequent updates to incorporate the latest screening, triaging, and monitoring guidance, which for COVID-19 changes daily.
[..] Many benefits would accrue from this kind of systematic symptom monitoring. During pandemics such as COVID-19, public health authorities would better understand the epidemiology of the new disease, track disease outbreaks and potential disease outbreaks, and manage capacity to reduce unnecessary in-person visits when patients have had stable symptoms. Symptom monitoring programs could also deliver tailored education and guidance, such as recommendations for hand washing and quarantines, lessening the burden on clinical staff during emergencies. During routine care, patients would be monitored for disease exacerbations, allowing for timely treatment adjustments to avoid poor outcomes.
[..] Systematic symptom monitoring will be achieved incrementally and should begin with simple patient self-reports to their clinicians using electronic tools such as phones and computers that we already use in other aspects of our lives. With dedicated effort, symptom monitoring could help with COVID-19 over the next one to two years. And when the next pandemic emerges (which it will), the majority of the US population’s symptoms will be monitored, and health care systems will be prepared to contain the disease.”
In The COVID-19 Era, And Beyond, Symptom Monitoring Should Be A Universal Health Care Function, Rudin RS, Friedberg MW, Solomon DH. Health Affairs Blog, 2020.6.18
2020.6.4
“National health care expenditures (NHEs) in the United States continue to grow at rates outpacing the broader economy: Inflation- and population-adjusted NHEs have increased 1.6 percent faster than the gross domestic product (GDP) between 1990 and 2018.
[..] The critical constraint in these settings is not technology: In fact, the most advanced technology required to routinely treat COVID-19—the mechanical ventilator—was invented nearly 100 years ago in response to polio (the so-called iron lung). Rather, the bottleneck relates to the total financial and human resources required to use the technology—the denominator of net productivity. The clinical implementation of ventilators has been illustrative: Health care workers are still required to operate ventilators on a nearly one-to-one basis, just like in the mid-twentieth century.
[Content versus Process Innovation] Content (also called technical) innovation refers to the creation of new widgets, such as biochemical agents, diagnostic tools, or therapeutic interventions. Contemporary examples of content innovation include specialty pharmaceuticals, molecular diagnostics, and advanced interventions and imaging.
These may be contrasted with process innovations, which address the organized sequences of activities that implement content. Classically, these include clinical pathways and protocols. They can address the delivery of care for acute conditions, such as central line infections, sepsis, or natural disasters. Alternatively, they can target chronic conditions through initiatives such as team-based management of hypertension and hospital-at-home models for geriatric care. Other processes include hiring staff, delegating labor, and supply chain management.
[Performance-enhancing versus Cost-reducing Innovation] Performance-enhancing innovations frequently create incremental outcome gains in diagnostic characteristics, such as sensitivity or specificity, or in therapeutic characteristics, such as biomarkers for disease status. Their performance gains often lead to higher prices compared to existing alternatives.
Performance-enhancing innovations can be compared to “non-inferior” innovations capable of achieving outcomes approximating those of existing alternatives, but at reduced cost. Industries outside of medicine, such as the computing industry, have relied heavily on the ability to reduce costs while retaining performance.
[..] the preponderance of performance-enhancing diagnostic and therapeutic innovations tend to address narrow patient cohorts (such as rare diseases or cancer subtypes), with limited clear clinical utility in broader populations.
[Additive versus Substitutive Innovation] Additive innovations are those that append to preexisting workflows, while substitutive innovations reconfigure preexisting workflows. In this way, additive innovations increase the use of precedent services, whereas substitutive innovations decrease precedent service use.
For example, previous analyses have found that novel imaging modalities are additive innovations, as they tend not to diminish use of preexisting modalities. Similarly, novel procedures tend to incompletely replace traditional procedures. In the case of therapeutics and devices, off-label uses in disease groups outside of the approved indication(s) can prompt innovation that is additive. This is especially true, given that off-label prescriptions classically occur after approved methods are exhausted.
[Sustaining versus Disruptive Innovation] Competitive market theory suggests that incumbents and disruptors innovate differently. Incumbents seek sustaining innovations capable of perpetuating their dominance, whereas disruptors pursue innovations capable of redefining traditional business models.
In health care, while disruptive innovations hold the potential to reduce overall health expenditures, often they run counter to the capabilities of market incumbents. For example, telemedicine can deliver care asynchronously, remotely, and virtually, but large-scale brick-and-mortar medical facilities invest enormous capital in the delivery of synchronous, in-house, in-person care (incentivized by facility fees).
[..] high-cost innovations are incentivized across health care stakeholders. From the supply side of innovation, for academic researchers, “breakthrough” and “groundbreaking” innovations constitute the basis for career advancement via funding and tenure. This is despite stakeholders’ frequent inability to generalize early successes to become cost-effective in the clinical setting. As previously discussed, the increasing influence of private entities in setting the medical research agenda is also likely to stimulate innovation benefitting single stakeholders rather than the system.
From the demand side of innovation (providers and health systems), a combined allure (to provide “cutting-edge” patient care), imperative (to leave “no stone unturned” in patient care), and profit-motive (to amplify fee-for-service reimbursements) spur participation in a “technological arms-race.” The status quo thus remains as Clay Christensen has written: “Our major health care institutions…together overshoot the level of care actually needed or used by the vast majority of patients.”
[..] Process redesign rarely involves novel gizmos, so much as rejiggering the wiring of, and connections between, existing gadgets. It targets operational changes capable of streamlining workflows, rather than technical advancements that complicate them. As described above, precisely these sorts of “frugal innovations” have led to productivity improvements yielding lower costs in other high-technology industries, such as the computing industry.
[..] Health systems adopting process redesign methods such as continuous improvement and value-based management have exhibited outcome enhancement and expense reduction simultaneously. Internal processes addressed have included supply chain reconfiguration, operational redesign, outlier reconciliation, and resource standardization.
Despite the potential of process innovation, focus on this area (often bundled into “health services” or “quality improvement” research) occupies only a minute fraction of wallet- or mind-share in the biomedical research landscape, accounting for 0.3 percent of research dollars in medicine. This may be due to a variety of barriers beyond minimal funding. One set of barriers is academic, relating to negative perceptions around rigor and a lack of outlets in which to publish quality improvement research. To achieve health care cost containment over the long term, this dimension of innovation must be destigmatized relative to more traditional manners of innovation by the funders and institutions determining the conditions of the research ecosystem.
Another set of barriers is financial: Innovations yielding cost reduction are less “reimbursable” than are innovations fashioned for revenue expansion. This is especially the case in a fee-for-service system where reimbursement is tethered to cost, which creates perverse incentives for health care institutions to overlook cost increases. However, institutions investing in low-cost innovation will be well-positioned in a rapidly approaching future of value-based care—in which the solvency of health care institutions will rely upon their ability to provide economically efficient care.”
Why Isn’t Innovation Helping Reduce Health Care Costs?, Cahan EM, Kocher R and Bohn R. Health Affairs Blog, 2020.6.4
“A widely used measure of premature mortality associated with life expectancy is years of life lost (YLL), a method used in the landmark Global Burden of Disease (GBD) study. The calculation of YLL is relatively simple. The difference between the observed age at death and the optimal remaining life expectancy at that age is calculated. [..] Although excess mortality for many conditions can be ascertained from the GBD data set, excess mortality associated with mental disorders is not fully captured in the YLLs estimated in the GBD studies. For example, if a person with schizophrenia subsequently develops cardiovascular disease and dies of a myocardial infarction 20 years earlier than the reference population, the entire 20 YLLs for this individual will be categorized as ischemic heart disease and not schizophrenia.
[..] In the past decade, methods have been developed that take a more realistic approach to age of onset, namely the estimation of life-years lost (LYL). After the onset of a disorder (eg, depression) at a specific age, the LYL method estimates the difference in remaining life expectancy compared with the entire population, which is matched by age and sex. A mean LYL estimate for specific disorders can be derived that takes into account all causes of death. Based on this method, life expectancy among those with a mental disorder has been reported as 10.2 years shorter in male individuals and 7.3 years shorter in female individuals compared with the general population. An additional benefit of this method is that the LYL can be fractionated into specific causes of death. The LYL estimates associated with broad categories of mental disorders and schizophrenia have been published. However, to date, no studies have estimated LYLs in those with a range of specific mental disorders.
[..] We estimated LYLs for persons with specific types of mental disorders and persons with 2 or more types of mental disorders. [..] In brief, for persons with a specific mental disorder, excess LYLs were quantified as the mean number of years lost after disease diagnosis and before a specific maximum age (set to age 95 years in this study) in excess of that experienced by persons in the general population of the same sex and age. The upper age limit of 95 years, which is greater than the life expectancy of the general Danish population, was set to ensure comparability with previous studies that reported LYL estimates among persons with mental disorders. The excess LYLs were further fractionated into specific causes of death.
[..] By the end of 2015, 425,927 persons (6.1%) had been diagnosed with at least 1 type of mental disorder; of those, 198 240 individuals (5.7%) were male and 227,732 individuals (6.5%) were female. In addition, 37% of those with mental disorders had 2 or more types of disorders, 12.4% had 3 or more types of disorders, and 4.1% had 4 or more types of disorders.
[..] A total of 21,526 persons (2.6%) died of suicide or of one of the causes included in the GBD list of mental disorder–associated causes of death. Suicide accounted for the highest YLL estimates in both sexes, but a marked difference was found in rates per 100,000 person-years by sex (among male individuals, 590.1 [95% CI, 583.8-596.5]; among female individuals, 202.3 [95% CI, 198.5-206.4]). The YLL rates per 100,000 person-years associated with alcohol use disorder were also higher in male individuals (568.7 [95% CI, 564.4-572.7]) than in female individuals (155.5 [95% CI, 153.5-157.9]). With the exception of drug use disorder, register-based YLL rates for 2015 were comparable to the summary-level YLL rates published in the GBD results database (eg, among male individuals with alcohol use disorder, the YLL rate per 100,000 person-years was 569 in the present study vs 551 [95% CI, 467-655] in the GBD database). Absolute YLLs were not comparable across the 2 methods, as the GBD analyses estimated YLLs for a period of 1 year, while we estimated YLLs for a period of 16 years.
With respect to LYLs, all mental disorders were associated with excess LYL estimates compared with the general population. The remaining life expectancy after diagnosis of any mental disorder was 11.2 years (95% CI, 11.1-11.3 years) shorter in male individuals and 7.9 years (95% CI, 7.8-8.0 years) shorter in female individuals compared with those in the general population of the same age. The disorder associated with the highest excess LYL estimates was opioid use disorder (for male individuals, 20.1 [95% CI, 19.3-20.9]; for female individuals, 19.0 [95% CI, 18.1-20.0]). Common mental disorders were also associated with substantial premature mortality. For example, in those with major depressive disorders, the excess LYL estimates were 8.3 (95% CI, 8.1-8.5) for male individuals and 6.4 (95% CI, 6.3-6.6) for female individuals. Similar LYL estimates were found in those with anxiety disorders (for male individuals, 7.5 [95% CI, 7.1-7.9]; for female individuals, 6.3 [95% CI, 6.0-6.6]).
[..] The YLL approach is also based on discrete types of causes of death; thus, when summed across a population, proportions associated with different types of cause of death can be readily calculated. However, a limited number of mental disorders are currently incorporated in the GBD analyses as potential causes of death to be used in the estimation of YLLs, which may result in an incomplete understanding of overall premature mortality among individuals with mental disorders. The YLL method only captures the cause of death associated with the single disease with which the death was associated, and the method omits any illnesses that may have had associations with that terminal disease. This omission necessarily results in an underestimation of the YLLs for illnesses associated with mental disorders. In contrast, the LYL method estimates the reduced life expectancy for any disorder or risk factor as a mean for a group of exposed individuals. Because the group is defined as individuals with at least 1 particular type of disorder (eg, those with depression), these individuals may also have a range of other mental and physical disorders, which means that the estimated LYLs inherently account for observed and unobserved comorbidities associated with mortality rates. However, because the LYL measurement is a mean of individual-level mortality, this method is not additive and thus not suitable for analyses that aim to estimate the population burden (ie, analyses similar to those used in the GBD studies).”
Association of Specific Mental Disorders With Premature Mortality in the Danish Population Using Alternative Measurement Methods, Weye N et al. JAMA Network Open 2020.6.3
“Drug prices are higher in the United States than in other countries in part because manufacturers are free to increase prices annually or semiannually. The cumulative effect of such increases can be substantial. An analysis of the top-selling drugs in the United States found that prices increased by more than 50% between 2012 and 2017 for more than three quarters of the drugs that had been available since 2012 and more than doubled for nearly half of them. The nonprofit Institute for Clinical and Economic Review has highlighted the absence of new clinical justification for some of these price increases.
In contrast, the German pharmaceutical system prohibits unilateral price increases after the initial phase of clinical assessment and price negotiation. Manufacturers may request a clinical reassessment of their product on the basis of new data and then seek to obtain a higher price. But claims of enhanced performance must be evaluated in a new comparative clinical assessment and approved by the G-BA [Joint Federal Committee (Gemeinsamer Bundesausschuss [G-BA]), a semipublic entity governed by associations of health insurance plans, physicians, hospitals, and patient advocates], and the price change must then be negotiated with the insurer association.
[..] In both Germany and the United States, drug spending is highly concentrated among the relatively small number of very sick patients who require specialty drugs, biologics, and gene therapies. Insurance executives in the United States worry that their plans will attract a disproportionate share of enrollees who need these expensive medications, which would force them to raise premiums to cover their higher costs. In turn, higher premiums could cause insurers to lose their healthy enrollees, who don’t care about coverage of expensive drugs but do care about premiums. Insurers defend themselves against this adverse selection by creating administrative hurdles that discourage enrollment by people who need expensive drugs, including prior-authorization requirements for physicians, and financial hurdles such as deductibles and coinsurance for patients.
[..] The German system also ensures that whichever health plan happens to enroll the sickest patients isn’t on the hook for disproportionately high costs. All health plans pay the same price for the same drug (e.g., large national plans aren’t favored over small regional plans), and all face a reallocation of premium revenues on the basis of the risk profiles of their enrollees.
Physicians in Germany are expected to adhere to the principle of efficient prescribing, meaning prescribing that is in keeping with the EMA’s product labels, the G-BA’s assessments of comparative benefit, and the clinical guidelines developed by their specialty societies. Within these broad and evidence-based boundaries, however, physicians are authorized to make decisions about the appropriate treatment for each of their patients without interference from insurers. Health plans are not permitted to exclude drugs from coverage (they don’t have “formularies” and must cover all prescription drugs approved for the German market). They cannot demand prior authorization from physicians as a condition of reimbursing a drug claim. They can, however, conduct retrospective audits of physicians whose prescribing patterns are substantially outside the recommendations of the EMA, the G-BA, and clinical guidelines. Such audits are very rare in practice. Limits on insurer interference reflect the recognition by health insurance plans that moderation in drug spending is to be pursued by means of control over prices rather than control over physician prescribing and patient adherence. Some observers have recommended that the United States adopt an analogous model, under which manufacturers agree to accept value-based prices in exchange for insurers reducing prior-authorization requirements and cost sharing so as not to impede appropriate patient access.”
Lower Prices and Greater Patient Access — Lessons from Germany’s Drug-Purchasing Structure, Robinson JC. New England Journal of Medicine 2020.6.4
“Among US current smokers who reported smoking in the past 30 days, the proportion of nondaily smokers increased from 19.2% in 2005 to 25.0% in 2018. The proportion of low-intensity daily smokers also increased, from 16.4% in 2005 to 25.0% in 2016. Nondaily smokers may differ substantively from daily smokers, both with regard to nicotine dependence and in reasons for smoking. In light of continued policy, regulatory, and societal changes and the emergence of other tobacco products, the numbers of occasional and low-intensity cigarette smokers are expected to increase.
[..] we harmonized multiple cycles of the Tobacco Use Supplement to the Current Population Survey (TUS-CPS) linked to the National Longitudinal Mortality Survey (NLMS), leveraging detailed information on smoking patterns among both nondaily and daily cigarette smokers with a large US representative sample size.
[..] We defined ever cigarette smokers as individuals who reported smoking 100 cigarettes or more in their lives. Current smokers reported smoking cigarettes in the past 30 days, either every day (daily smokers) or on some days of the month (nondaily smokers). Nondaily smokers were stratified into those who previously smoked daily (nondaily, previous-daily smokers) and those who never smoked daily (lifelong nondaily smokers). We categorized former smokers, who reported not smoking in the past 30 days, into former daily smokers and former nondaily smokers.
[..] Daily smokers smoked a median of 20 cigarettes per day (interquartile range [IQR], 10-20 cigarettes per day) (600 cigarettes per month [IQR, 300-600 cigarettes per month]). Nondaily smokers typically smoked on 15 days (IQR, 6-20 days for lifelong nondaily smokers; IQR, 10-20 days for nondaily, previous-daily smokers) of the month and smoked far fewer cigarettes per month than daily smokers (lifelong nondaily smokers: 40 cigarettes per month [IQR, 15-90 cigarettes per month]; nondaily, previous-daily smokers: 75 cigarettes per month [IQR, 30-150 cigarettes per month]). Nondaily and daily smokers both started smoking at a median age of 17 to 18 years. Among never cigarette smokers, 8.1% reported ever using other tobacco products (cigar, pipe, and smokeless tobacco), whereas approximately 20% to 23% of current cigarette smokers reported ever using other tobacco products. E-cigarettes and similar devices were not assessed in the surveys included in this analysis.
[..] Compared with daily smokers, lifelong nondaily smokers were more likely to be from racial/ethnic minority groups (non-Hispanic black, Hispanic, or other); the percentages of those from racial/ethnic minority groups were 37.2% for lifelong nondaily smokers, 21.7% for nondaily, previous-daily smokers, and 17.8% for current daily smokers. More current nondaily smokers (lifelong nondaily smokers, 19.9%; nondaily, previous-daily smokers, 20.7%) had a college education than current daily smokers (10.6%).
[..] Lifelong nondaily smokers had 1.82 times higher all-cause mortality risk than never smokers (95% CI, 1.65-2.01). Risks were higher among daily smokers (HR, 2.32; 95% CI, 2.25-2.38) and comparable for nondaily, previous-daily smokers (HR, 1.93, 95% CI, 1.80-2.07).
[..] Among lifelong nondaily smokers, mortality risks increased in association with higher numbers of cigarettes per month. The HRs (95% CIs) for all-cause mortality were 1.18 (0.79-1.75) for 5 or less cigarettes per month, 1.80 (1.23-2.64) for 6 to 10 cigarettes per month, 1.56 (1.24-1.96) for 11 to 30 cigarettes per month, 1.91 (1.49-2.44) for 31 to 60 cigarettes per month, and 2.16 (1.83-2.54) for more than 60 cigarettes per month.
[..] the mortality risks of reducing the level of smoking from daily to nondaily. A dose-dependent association was observed, whereby the lowest risk was observed among respondents who reduced their level of smoking from daily to nondaily 10 or more years ago (HR, 1.73; 95% CI, 1.56-1.92), similar to the risk among lifelong nondaily smokers.”
Dose-Response Association of Low-Intensity and Nondaily Smoking With Mortality in the United States, Inoue-Choi M et al. JAMA Network Open 2020.6.3
“While quality measurement and reporting have led to significant quality increases for well-defined problems like central line-associated bloodstream infections, they haven’t transformed the healthcare delivery system or led to fundamental changes in quality, life expectancy, healthspans or healthcare costs and spending. That’s despite several landmark reports and an increased focus to improve healthcare quality and its measurement.
[..] COVID-19 could be an opportunity for the federal government to take a step back and decide whether programs should be significantly changed or permanently sunset, industry insiders said.
“This moment should serve as an impetus for CMS and HHS to reevaluate their national quality agenda, and their approach to quality measurement and improvement,” said Dr. Rishi Wadhera, a cardiologist at Beth Israel Deaconess Medical Center and instructor at Harvard Medical School.
[..] “There’s understandable frustration among the provider community about the amount of burden that they’ve had to bear in the last 10, 15 years without seeming to improve care,” said Dr. David Lansky, former CEO of the Pacific Business Group on Health, now a senior advisor to the organization.
[..] It’s also hard to see how HHS and CMS can return to the status quo after the public health emergency ends, Wadhera said. The federal government has many programs that link payment to quality measures, but there’s mounting evidence that it “hasn’t really worked.” He said that it wouldn’t make sense to go back to financially penalizing health systems based on their performance shortly after bailing them out.
[..] Most experts agree that more alignment of quality measures would be beneficial, but some fear HHS is overly concerned about provider burden. HHS cites “parsimony” as one of its goals for federal quality measures, but experts say the primary goal should be to get useful information, not to streamline reporting.
[..] With a greater focus on evaluation, HHS could likely increase alignment and simplify reporting, which could improve quality and free up providers to devote more resources to patient care. There’s been such an “insatiable appetite for this expansive approach to data collection” that it’s caused policymakers and the industry to lose sight of their goal to understand the healthcare system better, [secretary of the Florida Agency for Health Care Administration Mary] Mayhew said.
COVID-19 should be a catalyst to get quality right, experts say, Brady M Modern Healthcare 2020.6.3
2020.6.2
“The earliest prison-based SEP [syringe exchange program] began in Switzerland and quickly decreased transmission of HIV, hepatitis B, and hepatitis C. Prison-based SEPs have since been initiated in >60 countries with additional successful outcomes: prisons with SEPs in Germany and Spain, for example, reported no cases of HIV/HCV seroconversion among incarcerated people, strongly reduced needle sharing, and demonstrated no increases in drug use. In Australia, Canada, Iran, and throughout Europe, many prisons offering MOUD have noted improved prison safety, decreased rates of recidivism and reincarceration, and reduced injection drug use, needle sharing, and mortality. Lastly, in countries such as Canada, Australia, Brazil, South Africa, Iran, and Indonesia, prisons widely offer condoms, lubricant, and dental dams to reduce the risk of HIV/HCV sexual transmission; none of these prisons have reversed their policy nor have they reported any unfavorable outcomes or security issues. In the US, access to harm reduction, even outside the prison system, is limited. North American Syringe Exchange Network data show seven states have no SEPs and 26 states have ≤5 SEPs, leaving much of the population without access to sterile injection equipment. In US prisons, there are no SEPs and limited access to MOUD [medications for opioid use disorder] and condoms, leaving thousands of incarcerated people at elevated risk of drug use-associated morbidity and mortality.
[..] There are no insurmountable barriers to the implementation of harm reduction services in US prisons. No federal law prohibits the provision of sterile injection equipment to incarcerated people. Most of the resistance to SEPs lies in unsubstantiated fears that they encourage drug use and could lead to syringe-associated violence against guards. In reality, there is no evidence to show that SEPs increase drug use; instead, they lead to engagement with the healthcare system and can facilitate entry into SUD [substance use disorder] treatment. Among all international prison-based SEPs, no cases of syringe-associated violence have been reported; instead, prison staff report feeling more protected from infection after the institution of SEPs. Furthermore, every dollar spent on SEPs returns $4 in healthcare savings and every dollar spent on MOUD can return $12 in total savings, accounting for both the cost of drug-related crime and healthcare delivery. While the cultural barriers to prison-based SEPs are formidable, harm reduction interventions are uniformly beneficial and cost-effective.”
Prison-based harm reduction services are needed to address the dual substance use disorder and infectious disease epidemics in US prisons, Ohringer AR, Ezer T and Serota DP. EClinicalMedicine 2020.5.18
“the most recent of the 3 trials that established the clinical benefit of CEA [carotid end-arterectomy] compared with medical therapy in asymptomatic patients was initiated 25 years ago. In the intervening period, new pharmacological advances, such as high-potency statins6-9 and improved antiplatelet regimens, as well as quality improvements in the treatment of blood pressure and diabetes14 may be associated with the reduced stroke rate among patients with asymptomatic carotid stenosis.
[..] we identified 219,979 veterans of the US Armed Forces aged 65 years or older with at least 1 visit to a VA facility for primary care (eg, general medicine, women clinic) or subspecialty care (eg, geriatrics, cardiology, endocrine, pulmonary, or neurology) who received diagnostic carotid imaging (ie, carotid ultrasonography, computed tomography angiography, or magnetic resonance angiography) between January 1, 2005, and December 31, 2009 [..]. To create a cohort of patients with asymptomatic carotid stenosis, we excluded all patients with carotid imaging test results who had any form of stroke or transient ischemic attack (TIA) in the 6 months before the imaging test using a highly sensitive algorithm based on ICD-9 codes; we modified the algorithm for this study to also exclude retinal strokes and TIAs.
[..] We imported all text reports for patients with at least 1 carotid imaging showing stenosis of 50% or greater (n = 71,839) into a database for human screening. In this preliminary screening process, we identified all patients who had carotid imaging text reports indicating greater than 70% carotid stenosis or a qualitative description of near occlusion, critical stenosis, or severe stenosis. Subsequent medical record review was used to confirm stenosis. We identified 13,371 potentially eligible patients with stenosis of 70% or greater.
[..] The first step in our analytical strategy was to construct a sample of patients in the initial medical therapy cohort who were similar to those in the CEA cohort. We used propensity score matching to identify these similar patients.
[..] The stroke risk at 5 years of follow-up was 5.4% (95% CI, 4.7%-6.2%) in the CEA cohort and 6.2% (95% CI, 5.7%-9.5%) in the initial medical therapy cohort. The risk difference between the 2 cohorts when the competing risk of death was taken into consideration was smaller than previously observed and not statistically significant at the α = .05 level (risk difference, –0.8%; 95% CI, –2.1% to 0.5%). This finding suggests that little to no difference existed between CEA and initial medical therapy when the competing risk of nonstroke death was incorporated into the analysis.
[..] This analysis suggested that little to no difference existed between the 2 treatment strategies after accounting for competing causes of death. These analyses, when taken together, suggest that in real-world practice medical therapy may be an equally acceptable treatment strategy for patients with asymptomatic carotid stenosis.
[..] In the past decade, stroke has dropped from the third to the fifth leading cause of death in the US. This improvement has been attributed to several factors, including more aggressive diabetes and hypertension control and advances in medical therapy (eg, statins). The decrease in stroke risk in the initial medical therapy cohort in the present study was likely associated with more effective control of atherosclerotic risk factors in the VA. However, medical therapy could be improved in both the CEA and initial medical therapy cohorts. Over the past 2 decades, the VA has been tracking blood pressure, glycemic, and lipid targets and has achieved substantial improvements in cardiovascular risk factor control. In addition, the stroke risk estimated in the 2 cohorts preceded the publication of the SAMMPRIS (Stenting and Aggressive Medical Management for Preventing Recurrent Stroke in Intracranial Stenosis) trial, which likely focused even more attention on improving the delivery of medical care. It is possible that, with the use of high-potency statins, the stroke risk has decreased even further.
[..] The absolute reduction in the risk of fatal and nonfatal strokes associated with early CEA intervention found in this study appeared to be less than half the risk difference observed in trials initiated more than 2 decades ago. This reduction was no longer statistically significant when the competing risk of nonstroke deaths were accounted for in the analysis. Given the up-front perioperative risks associated with CEA, initial medical therapy may be an equally acceptable treatment strategy for the management of patients with asymptomatic carotid stenosis.”
Comparative Effectiveness of Carotid Endarterectomy vs Initial Medical Therapy in Patients With Asymptomatic Carotid Stenosis, Keyhani S et al. JAMA Neurology 2020.6.1
“We used a national 20 percent sample of Medicare administrative claims for the period 2011–15 from the Inpatient File and the Outpatient File. To identify avoidable hospitalizations and avoidable observation stays for ambulatory care–sensitive conditions, we applied the Agency for Healthcare Research and Quality’s (AHRQ’s) Prevention Quality Indicators software to the Medicare data. We examined claims from visits for acute conditions (dehydration, bacterial pneumonia, urinary tract infections, and perforated appendix) and chronic conditions (including both short- and long-term complications of diabetes, uncontrolled diabetes, lower extremity amputation related to diabetes, asthma in adults, chronic obstructive pulmonary disease [COPD], hypertension, heart failure, and angina treated without procedure). The AHRQ software excluded certain types of patients depending on the condition—such as transfer patients, pregnant patients, immunosuppressed patients, and those who had undergone certain types of urological procedures for urinary tract infections. To obtain patient characteristics, we used the Medicare Master Beneficiary Summary File. To identify patient comorbidities, we used the Chronic Conditions Data Warehouse.
[..] In 2011 black beneficiaries were, on average, younger and more likely to be dually eligible for Medicaid and Medicare, and they had a higher number of chronic conditions, compared to white beneficiaries. For example, black beneficiaries had higher rates of dementia, chronic kidney disease, diabetes, and history of stroke or transient ischemic attack. However, white beneficiaries had higher rates of certain types of chronic conditions, including atrial fibrillation and COPD, compared to black beneficiaries. Similar differences in patient demographic characteristics and comorbidities were observed in 2015.
[..] In 2011 black beneficiaries experienced 674.8 avoidable hospitalizations per 10,000 people, while white beneficiaries had 546. per 10,000 people. In 2015 the rates dropped to 483.9 per 10,000 people for black beneficiaries and 407.8 per 10,000 people for white beneficiaries. The yearly slope change was −46.2 per 10,000 per year for black beneficiaries and −33.2 per 10,000 per year for white beneficiaries [..]. The difference in slopes was −13.1 per 10,000 per year (95% confidence interval: −15.6, −10.6), which means that black beneficiaries experienced a greater decline in avoidable hospitalizations during this time, compared to white beneficiaries. In terms of relative improvement, black beneficiaries experienced a 28 percent relative decrease, while white beneficiaries experienced a 25 percent relative decrease.
[..] In 2011 the rate of avoidable observation stays was 417.9 per 10,000 for black beneficiaries and 378.8 per 10,000 for white beneficiaries. In 2015 the rates of observations increased, to 570.6 per 10,000 and 470.6 per 10,000 for blacks and whites, respectively. The yearly slope change was 39.2 per 10,000 per year for black beneficiaries and 23.2 per 10,000 per year for white beneficiaries. The difference in slopes was 16.0 per 10,000 per year (95% CI: 11.3, 20.6), which means that black beneficiaries experienced a greater increase in avoidable observation stays during this time, compared to white beneficiaries. In terms of relative improvement, black beneficiaries experienced a 37 percent relative increase, while white beneficiaries experienced a 24 percent relative increase.
[..] When we combined avoidable observation stays and hospitalizations, we did not find a significant difference in the slopes between black and white beneficiaries. For all conditions, the slope of improvement for black beneficiaries was −6.3 per 10,000 per year, compared to −3.0 per 10,000 per year for white beneficiaries. The difference in slopes was −3.2 per 10,000 per year (95% CI: −8.6, 2.1).
[..] We found that changes in rates of avoidable hospitalizations and observation stays for chronic conditions were the primary driver of our findings. For chronic conditions, the slope of avoidable hospitalizations for black beneficiaries was −27.6 per 10,000 per year, while it was −17.0 per 10,000 per year for white beneficiaries—a difference in slopes of −10.6 per 10,000 per year (95% CI: −12.5, −8.6). The slope of avoidable observations for chronic conditions was 33.0 per 10,000 per year for black beneficiaries and 17.5 per 10,000 per year for white beneficiaries—a difference in slopes of 15.4 per 10,000 per year (95% CI: 11.6, 19.3). This substitution effect appeared to be predominantly driven by the following ambulatory care–sensitive conditions: long-term complications of diabetes, COPD/asthma, hypertension, and heart failure. For acute conditions, white beneficiaries, on average, had higher rates of avoidable hospitalizations and observation stays than black beneficiaries did, and these hospitalizations and stays were predominantly driven by visits for bacterial pneumonia.
[..] Using national Medicare data, we examined whether racial disparities in avoidable hospitalizations, a metric frequently used to assess the accessibility of high-quality primary care, have narrowed over time. Although we initially found that the gaps have narrowed, upon further examination we found that this narrowing appears to be entirely related to differential changes in shifting to observation status—with black beneficiaries being coded as admitted to observation status at a higher rate over time than white beneficiaries were. This substitution effect was primarily driven by shifts in heart failure and complications of diabetes. It also appears that the substitution effect was primarily driven by changes occurring among high-risk Medicare beneficiaries—those with the highest Hierarchical Condition Categories risk scores. Therefore, our findings suggest that much of the progress in improving disparities in potentially avoidable hospitalizations may be explained by the increased use of observation status rather than by changes in other factors, such as the quality of care in the ambulatory setting.
[..] the designation of observation status for patients has major financial implications, given that Medicare beneficiaries in that status tend to incur higher out-of-pocket spending than patients admitted to a hospital. In addition, observation patients might not qualify for Medicare coverage for subsequent skilled nursing facility care. Therefore, this disproportionate substitution effect observed in black beneficiaries raises concerns that minority patients are facing increased financial burden as a result of differential decision making by physicians and hospitals. As providers take on more risk in alternative payment models that increase pressure to reduce hospital admissions, it will be important to ensure that these new incentives to lower costs do not lead to harm for minority patients or patients in general, especially given that the substitution effect seems to be occurring mostly among high-risk patients. This is also pertinent given recent work that showed a possible association with increased mortality for patients admitted with heart failure after the Hospital Readmissions Reduction Program was introduced.
[..] The changes in disposition practice may reflect efforts by hospitals trying to avoid penalties levied by the Hospital Readmissions Reduction Program or health systems participating in accountable care organizations trying to improve their rates of avoidable hospitalizations. It will be important for policy makers to consider updating the quality measures in existing value-based programs to limit any potential gaming by health care providers. One way to do so would be to include in the metric not just inpatient admissions but also observation stays—and potentially ED visits—related to ambulatory care–sensitive conditions. In addition, to the extent that better primary care leads to improvements in disparities in avoidable acute care use, policy makers may need to consider new approaches that could improve the care delivered to vulnerable populations.”
Avoidable Hospitalizations And Observation Stays: Shifts In Racial Disparities, Figueroa JF et al. Health Affairs 2020.6.1
“Using secure patient portals to link care partners to the health care team should be a priority for health care organizations, but few have perfected this process. To increase the likelihood that care partners can use patient portals effectively, we suggest several steps.
First, vendors should offer simplified procedures for granting proxy access, including online registration with multifactor authentication to promote security. Health care organizations should follow the lead of the banking industry and allow patients and proxies to register efficiently online, rather than require in-person registration.
Second, vendors should develop a simple mechanism for noting and displaying care partner names and contact information in the EHR, along with privacy settings that allow patients to grant proxy access to selected portions of their records. Split records, which help both parents and their adolescent children maintain appropriate boundaries in sensitive areas, could serve as a model for developing a more private data sharing practice.
Third, patients and care partners require organized and comprehensive education on patient portals. Many patients and care partners may not know how to access a patient portal, and educational campaigns that involve the front desk staff, medical assistants, and clinicians can help ensure that portals are incorporated into the clinical practice.
Fourth, the US Congress needs to modernize HIPAA. It must ensure that HIPAA rules for preserving the privacy of patient and associated data also cover third-party applications’ access to EHRs.
In addition, patients and their proxies need both easy-to-understand information and a user-friendly consent mechanism. These features must clearly explain what happens to their health data, should they choose to access the data through third-party applications.
Care partners value having access to their loved one’s information. The patient portal is a convenient way to access test results and clinical notes, communicate with health care practitioners, and link care partners to the clinical team, making it a powerful tool for realizing the goals of care.”
Care Partners and Patient Portals—Faulty Access, Threats to Privacy, and Ample Opportunity, DesRoches CM, Walker J and Delbanco T. JAMA Intern Med 2020.5.4
2020.6.1
“It is axiomatic that finding a significant difference should be predicated on formal hypothesis testing, which in EXCEL was prespecified as demonstration of noninferiority at 3 years, not superiority, which is what was evaluated by the investigators at 5 years. The rationale for this change is unclear because it was not prespecified in the protocol and was unstated in the manuscript.
[..] In the EXCEL trial, the definition of MI was biased in favor of PCI because it used a less stringent criterion of predominantly biomarker elevation instead of the more stringent requirement of new Q waves observed on electrocardiograms plus biomarker elevation that has been used in most comparable trials. This different definition of MI explains why 5-year MI rates in the CABG arm of the EXCEL trial are nearly 2- to 5-fold (9.1%) as high as the other 3 trials [..].
[..] The bayesian framework considers prior information and the current trial results as part of a continual data stream, in which inferences are updated each time new data become available. Rather than estimating the probability of the results observed given the hypothesis as in the frequentist approach that is commonly used, bayesian analysis aims to estimate the probability of the hypothesis given the results. Such probability statements are more likely than the frequentist P values to be interpreted correctly by clinicians and patients. A singular advantage of the bayesian approach is that it allows probabilities for different magnitudes of treatment effect, including clinically important effects, to be estimated.
Bayesian analysis is typically used for 2 types of statistical inference: hypothesis testing to ascertain presence or absence of an effect using the Bayes factor (the ratio of the likelihood of the null hypothesis to the likelihood of the alternate hypothesis) which quantifies the weight of evidence coming from the data, and parameter estimation to determine the size of the effect. Brophy focuses on the latter, generating posterior distributions, but instead of computing a pooled estimate of the results of the 4 trials via a bayesian meta-analysis, he integrated collective prior information obtained from 3 trials comparing PCI and CABG for patients with LMCAD with EXCEL to obtain an updated estimate. Brophy’s approach exemplifies the natural sequential learning approach afforded by the bayesian method.
The key finding from this bayesian reanalysis using the noninformative prior (where all effect sizes are equally likely and where the inference is driven predominantly by the trial data, as in the frequentist approach) is that there is 99% probability that total mortality for patients with LMCAD is increased with PCI and 94% probability that the increased risk exceeds 1%, a clinically important threshold. The corresponding probabilities for increase in MACE are 95% and 87%; and for major adverse cardiac and cerebrovascular events (MACCE), 99.9% and higher than 99%. Integrating prior information from the 3 trials with EXCEL reduces risk estimates for total mortality and for MACE but not for MACCE. The updated probabilities for risks higher than 0% and higher than 1% with PCI are, respectively, 85% and 47% for total mortality, 96% and 86% for MACE and 100% and 100% for MACCE. The pooled mortality benefit of CABG remains, although moderated. Thus, the overall mortality results of the reanalysis by Brophy clearly favor CABG with additional reductions, compared with the use of PCI, in nonprocedural MI and repeat revascularization procedures, and no increase in stroke.
The study by Brophy highlights the advantage of the bayesian approach in providing a wider and more informative set of interpretations than that typically provided by frequentist analysis. The results suggest high probability of a clinically important benefit with CABG over PCI especially in terms of MACCE, revascularization, and even mortality. Thus, the suggestion by EXCEL investigators that the treatment strategies are comparable is questionable at best, and at worst risks unnecessary and avoidable deaths of patients with LMCAD.
The current European revascularization guidelines, issued in 2018, endorse PCI as a Class IA recommendation in patients with LMCAD with low anatomical complexity. This recommendation was, in large part, driven by the 3-year results of EXCEL, which showed PCI to be noninferior to CABG. As summarized in the study by Brophy, the quality and the quantity of evidence is insufficient to support this recommendation. The treatment of choice for LMCAD should be CABG regardless of anatomical complexity. Therefore, the guideline recommendation for PCI for low-complexity LMCAD should be downgraded in alignment with the new evidence.”
Should Percutaneous Coronary Intervention Be Considered for Left Main Coronary Artery Disease? Insights From a Bayesian Reanalysis of the EXCEL Trial, Kaul S. JAMA Internal Medicine 2020.6.1
“For many people with diabetes, the necessary prescriptions go beyond test strips, lancets, and syringes to include durable medical equipment for insulin pump supplies (infusion sets, reservoirs, and pods), continuous glucose monitoring devices (sensors, transmitters, and receivers), glucagon in case of a hypoglycemic emergency, glucose tablets or glucose gel, and ketone test strips for early detection of ketosis. Some patients with type 2 diabetes may need treatment with other glucose-lowering agents, such as GLP-1 (glucagon-like peptide 1) receptor agonists or SGLT-2 (sodium-glucose cotransporter 2) inhibitors, which add substantial costs. Furthermore, diabetes care relies on regular outpatient visits, often with multiple different clinicians, and laboratory testing to guide clinical decisions.
In another article in this issue of JAMA Internal Medicine, Chua and colleagues demonstrate that insulin and these other diabetes-related costs in the US are substantial for patients with type 1 diabetes. Using data from the IBM MarketScan Research Database, the authors found that mean annual out-of-pocket spending on insulin, diabetes-related supplies, diabetes-related services, and all other health care services was $2414 per person in 2018. Of this total, spending on insulin amounted to $435 and accounted for 18% of out-of-pocket expenditures. Mean spending on diabetes-related supplies was $490, and mean spending on type 1 diabetes-related services was $385, accounting for a considerable proportion of annual out-of-pocket expenditures.
[..] Although capping insulin copayments is a step in the right direction, such a state law does not protect many individuals with federally regulated insurance plans, with Medicare, or without any insurance. In addition, insulin copayment caps do little to ease the financial burden of paying for diabetes-related supplies or other health care services.”
Expensive Insulin—The Epicenter of a Large, Life-Threatening Problem, Nally LM and Lipska KJ. JAMA Internal Medicine 2020.6.1
“In the United States, the provision of physical and behavioral care (mental health and substance use treatment) has been compartmentalized into 2 distinct and largely parallel systems. This separation persists despite 2 decades of research showing that integrating behavioral health into primary care practices in particular can enhance patient care, reduce costs, and improve social functioning of persons with depression. A 1996 Institute of Medicine consensus study report on primary care cautioned that mental health and primary care are inseparable, and any attempts to separate them leads to inferior care. It is evident that behavioral health services should be an integral part of comprehensive primary care. There is increasing recognition of the bidirectional nature of behavioral and physical health: 68% of persons with a mental health problem also have medical conditions, and persons with chronic illness are twice as likely to have mental illness.
[..] A study comparing the 2 predominant models—co-location and collaborative care—demonstrated a 14% reduction in Patient Health Questionnaire-9 scores (denoting improvement in depression symptoms) in the co-located practices compared with a 33% reduction in the collaborative care practices. Co-location has been shown to improve initial visit engagement but not depression outcomes, and it does not ensure effective collaboration. The collaborative care model uses a team, including a care manager, patient registry support, and psychiatric case review. It can also be adapted to a telemedicine-based model, which can be effectively used in many rural areas and in smaller practices. [..]”
The Challenges of Behavioral Health Integration: The Persistence of the Mind–Body Problem, Bornstein S. Annals of Internal Medicine 2020.6.2
“Most attributes of RCT design, conduct, results, and reporting can be quantified and analyzed using statistical methods. For example, the fragility of study findings (ie, Fragility Index) may be defined by the minimum number of patients whose outcomes, if switched from a nonevent to an event, would convert a statistically significant result to a nonsignificant result. Lower values indicate less robust results. Similarly, the reporting of implied advantages of the experimental intervention despite nonsignificant differences in the primary outcome (ie, spin) may also be measured and quantified.
[..] the following strategies of spin were considered for superiority design trials: (1) focusing on secondary statistically significant results (within-group comparison, secondary outcomes, subgroup analyses, and modified population of analyses), (2) interpreting statistically nonsignificant results for the primary outcomes as showing treatment equivalence or comparable effectiveness, and (3) claiming or emphasizing the advantage of the experimental treatment despite statistically nonsignificant results. For noninferiority design trials, spin was considered when trials (1) claimed or emphasized noninferiority despite not establishing noninferiority boundaries or when data were inconclusive, and (2) focused on other results (such as secondary outcomes or information from other studies) when noninferiority was not established, inconclusive, or unclear.
[..] The Fragility Index is defined as the number of patients whose status would need to switch from a nonevent to an event to render a statistically significant difference not significant. The results for each outcome were entered in a 2 × 2 contingency table, and then the P value for each outcome was calculated with a 2-sided Fisher exact test. Single participants were iteratively shifted 1 at a time in the lower-incidence treatment group from nonevent to event, and the P value for the 2 × 2 table was recalculated. The Fragility Index for an outcome equaled the smallest number of patients required to turn the recalculated P value nonsignificant (P ≥ .05). Lower values indicate less robust results.
[..] Of the 115 trials that used major clinical events as primary outcomes [N=216], 57 (49.6%) were commercially sponsored and 58 (57.4%) were noncommercially sponsored. At multivariable regression analysis, commercial sponsorship was inversely associated with the use of major clinical events as a primary end point (Exp[β], 0.31; 95% CI, 0.12-0.85).
[..] Of the 84 trials that reported nonsignificant differences in the primary outcome, spin was identified in 55 (65.5%), including 29 (80.6%) of 36 commercially sponsored trials and 26 (54.2%) of 48 noncommercially sponsored trials (P = .02). [..] After adjusting for differences in trial characteristics, we found that commercial sponsorship was associated with significantly greater extent of spin (Exp[β], 4.64; 95% CI, 1.05-20.54).
[..] In the present study, we found no difference in estimated treatment effect, length of follow-up, use of composite or clinically significant outcomes, or outcome modification compared with the published protocol between commercially and noncommercially sponsored trials. The more frequent use of noninferiority design, especially when coupled with the higher number of patients lost to follow-up, or the more subtle differences in trial characteristics that were not captured in this cross-sectional study may explain the association between commercial sponsorship and favorable findings. Alternatively, commercially sponsored trials are larger, more inclusive, and more often multicenter than noncommercially sponsored studies, which may make their results more generalizable. Commercially sponsored trials are more often preregistered, more robust, and more authoritative in the research world, as evidenced by publication in journals with higher impact factor and by more frequent citations.
In more than 65% of the studies with no statistically significant difference in primary outcomes, we found evidence of interpretation bias. Spin was significantly associated with commercial sponsorship.”
Characteristics of Contemporary Randomized Clinical Trials and Their Association With the Trial Funding Source in Invasive Cardiovascular Interventions, Gaudino M et al. JAMA Internal Medicine 2020.6.1
2020.5.30
“The motive for integrated care is grounded on the view that AF [atrial fibrillation] is not merely an isolated heart rhythm disorder with an increased risk of stroke, but more, in general, a ‘hypercoagulable state’ caused by (or associated with) the presence of multiple underlying and interacting comorbidities. Consequently, notably for elderly AF patients, management is evolving towards a more integrated care including also management of comorbidities.
[..] the RACE 4 trial confirmed that integrated, nurse-led care reduced cardiac mortality and hospitalization, yet only when provided in experienced AF clinics. Hence, it is yet unknown whether such integrated care could be safely orchestrated in primary care [..]
[..] this study was designed as a non-inferiority study regarding the primary outcome of all-cause mortality
[..] intervention consisted of three pivotal items: (i) quarterly AF check-ups by the practice nurse on symptoms and comorbidities, notably assessment of early signs and symptoms of heart failure and also patient education, (ii) case management of anticoagulant treatment, including international normalized ratio (INR) measurements performed by the intervention practice in those treated with a vitamin K antagonist (VKA), special attention to drug compliance, and monitoring of kidney function in patients using a non-vitamin K antagonist oral anticoagulant (NOAC), and (iii) easy-access consultation of anticoagulation clinics and/or cardiologists, thus truly enabling ‘shared care and responsibility’ between primary care, anticoagulation clinics, and cardiology care.[..] Practice nurses in the intervention practices received a 3 h training at the start of the intervention with education on signs and symptoms of AF and heart failure, rate and rhythm control, anticoagulant treatment, and an explanation of the most important recommendations of the guidelines on AF. In addition, we organized three meetings throughout the 2-year follow-up period for both practice nurses and GPs to (i) share experiences and ‘best practices’, (ii) discuss complex patients, and (iii) provide additional education on topics based on existing questions of the practice nurses. Decisions regarding pharmacotherapy and referral to cardiology care were left to the GPs, guided by the Dutch College of General Practitioners’ guidelines on AF.
[…] The HR for all-cause mortality, after adjustment for age, sex, and FI [frailty index], was 0.55 (0.37–0.82).[..] When we repeated the analysis including the 411 patients who did not sign informed consent for participation in the intervention arm, the effect was attenuated but a reduction in all-cause mortality was still observed [adjusted HR 0.81 (0.61–1.07)], though the confidence interval (CI) overlapped with 1.0.
[..] risk reduction of non-cardiovascular mortality in intervention practices was more pronounced than risk reduction of cardiovascular mortality [adjusted HR for non-cardiovascular mortality 0.47 (95% CI 0.27–0.82), compared to adjusted HR 0.63 (95% CI 0.37–1.06) for cardiovascular mortality].
[..] our primary care study population was on average 10 years older than the population studied in a systematic review on integrated AF care in tertiary care (mean age 77.4 vs. 66.9 years) and more often suffered from comorbidities. Furthermore, contrary to many younger patients in the hospital setting who receive rhythm control therapy (e.g. ablation procedures), treatment in our study population was typically focused on chronic disease management. Such differences notwithstanding, Hendriks et al. found a similar reduction in their primary outcome, i.e. a 35% reduction of the risk of the composite outcome of cardiovascular hospitalization and cardiovascular death. Our findings are also in line with the exploratory analysis of the RACE 4 trial showing a favourable effect of nurse-led care, albeit only in experienced centres (HR 0.52; 95% CI 0.37–0.71). As the authors state, this emphasizes the importance of training and a focus on team-based integrated care approaches.
[..] we believe that the protocolled primary care approach including training of practice nurses in AF management and early recognition of clinical deterioration or complications, such as heart failure, was paramount for the observed effect on all-cause mortality. This is exemplified by the fact that urgent hospitalization occurred less frequently in our intervention arm, which was shown in a post hoc exploratory analysis (adjusted IRR 0.79; 95% CI 0.63–1.00). Additionally, repeated focus on cardiovascular risk management, including management of hypertension and lipid levels, may have contributed. Comprehensive and structured management seem to be important drivers of the beneficial effects, as these were common aspects of both our study and the previously mentioned studies on integrated AF care that also showed positive results. The RACE 3 trial showed, as a proof of concept, that addressing classical cardiovascular risk factors has beneficial effects on ‘AF progression’, defined as the proportion of time in sinus rhythm. Furthermore, the beneficial effect in our study was more pronounced for non-cardiovascular mortality, likely because cardiovascular and non-cardiovascular causes of death are often interrelated. For example, a patient dying from pneumonia might have survived if his underlying heart failure or AF had been better controlled. [..] The absence of an effect on ischaemic stroke and bleeding outcomes suggests that the reduction in all-cause mortality is unlikely to be explained by better anticoagulation management in the intervention arm. Prompted by this observation, the largest of the three involved anticoagulation clinics performed a post hoc analysis of the time in therapeutic range of patients using a VKA in their region, which was similar between intervention and control patients (68.2% vs. 68.1%, respectively), thus strengthening this conclusion.”
Integrated management of atrial fibrillation in primary care: results of the ALL-IN cluster randomized trial, Dries CJ et al. European Heart Journal 2020.2.25
2020.5.29
“Leading patient safety experts working with the Leapfrog Group developed an independent, inexpensive, and standardized tool embedded in Leapfrog’s annual voluntary hospital survey to evaluate the performance of EHR systems in reducing adverse drug events (ADEs) using simulated real patients and real-world inpatient medication orders. The tool has been used mainly in general acute care hospitals; more than 1800 hospitals used it in 2018. In a 2013 study of many hospitals, scores using this EHR [electronic health record] evaluation tool were strongly correlated with rates of preventable ADEs in included hospitals, with 4 fewer preventable ADEs per 100 admissions for every 5% increase in overall score.
[..] The Leapfrog CPOE EHR evaluation tool is a simulation that uses real-world test patients and medication orders to mimic the experience of a physician writing orders for actual patients to evaluate EHR safety performance. The test patients and orders were developed by a group of experts on ADEs and CPOE CDS to test how effectively hospital CPOE and EHR systems alert clinicians to potential ADEs. The test orders were developed specifically to assess whether orders that were likely to cause the most serious patient harm would be identified; almost all of these scenarios were drawn from real-world incidents of preventable ADEs from real patients who experienced injuries or death. The order types are divided into categories, orders with potential adverse events prevented by basic CDS (ie, drug-allergy, drug-route, drug-drug, drug-dose for single doses, and therapeutic duplication contraindications) and those that would require advanced CDS (ie, drug-laboratory, drug-dose for daily doses, drug-age, drug-diagnosis, and corollary orders contraindications). The primary outcome measure was whether the hospital CPOE EHR system correctly generated an alert, warning, or soft or hard stop after entering a test order that could have caused an ADE. The test had its content updated in 2010 and 2017, primarily to adjust to changes in drug formularies commonly used in hospitals; the performance of the test and the scoring of the test were not changed in either of these updates.
[..] a hospital representative downloads and enters a set of test patients with detailed profiles, including diagnoses, laboratory test results, and other information, into their EHR as real patients would be admitted to their hospital. A clinician with experience using the institution’s CPOE [computerized physician order entry] EHR application then enters test medication orders into the EHR for these test patients who have been admitted to the hospital and records in detail how the EHR responds, including what, if any, CDS in the form of alerts, messages, guidance, soft or hard stops, or other information are presented and whether the order is blocked or allowed to be entered in the EHR system. A hospital representative then enters all these responses in detail into the CPOE EHR evaluation tool, an overall score is immediately calculated, and a report is generated for the hospital. In addition to the overall score, 10 categorical scores are then presented to the hospital, with categories such as allergy, drug interaction, renal dosing, excess daily dosing, wrong drug route, disease-drug, drug serum level–checking, and drug-age contraindications. To ensure the test is taken as intended and to prevent gaming of the system, a number of control orders are included that are not expected to invoke any alerts.
[..] The overall mean (SD) total score increased from 53.9% (18.3%) in 2009 to 65.6% (15.4%) in 2018. Mean (SD) hospital score for the categories representing basic CDS increased from 69.8% (20.8%) in 2009 to 85.6% (14.9%) in 2018. For the categories representing advanced CDS, the mean (SD) score increased from 29.6% (22.4%) in 2009 to 46.1% (21.6%) in 2018.
[..] In the multivariate regression analysis, we found that when controlling for observable hospital characteristics, including size, teaching status, ownership model, system membership, and location, 3 vendors had higher CPOE assessment test scores: vendor A (β = 11.26; 95% CI, 8.10-14.42), vendor G (β = 5.49; 95% CI, 0.77-7.81), and vendor C (β = 3.57; 95% CI, 0.32-6.81). In determining how much variation in medication safety performance was explained by vendor, we calculated the partial R2 of regressing the vendors against the overall Leapfrog score and found that vendor choice explained 9.9% of variation in performance, while vendor choice combined with observable hospital characteristics from our full regression explained 14.6% of the variation.
[..] Some evidence suggests that advanced CDS, such as renal dosing contraindications, may be the most important type for improving medication safety. While most advanced CDS categories have improved little during the last 10 years, high performance is possible. Several hospitals have achieved a perfect score in all the categories of the test, representing each of the 9 leading EHR vendors being used by at least 1 hospital with a perfect score. Given that many of the ADEs potentially prevented by advanced CDS are significant areas of focus for many hospitals, such as managing polypharmacy for older patients, this slow progress is particularly concerning. Policy makers may wish to incentivize hospital safety improvements by including measures of CPOE EHR safety performance as quality benchmarks in future health care payment reform programs.
[..] It is often assumed by hospitals that the bigger the EHR vendor in terms of market share, the less the likelihood of safety performance problems. However, recent examples from other industries, notably the failure of the Boeing 737 airplane caused by software malfunction, underscores the risks of this assumption. In our results, the most popular vendor, vendor A, did have the highest mean safety scores, but there was variability among vendor A’s implementations, and the second-most popular vendor had among the lowest safety scores, with many smaller EHR vendors in the top 5 in overall safety performance. Additionally, while we found significant variation in safety performance across vendors, there was also heterogeneity within vendors, suggesting that both technology and organizational safety culture and processes are important contributors to high performance.
[..] Using a standardized, federally endorsed health IT safety measure, we have found that these systems meet the most basic safety standards less than 70% of the time and that these systems have only modestly increased their safety performance during a 10-year period, leaving critical deficiencies in these systems to detect and prevent critical safety issues. We also found associations between EHR vendor and medication safety performance. These findings emphasize the need to continually evaluate the safety performance of these systems in actual use with ongoing operational testing.”
National Trends in the Safety Performance of Electronic Health Record Systems From 2009 to 2018, Classen DC et al. JAMA Network Open 2020.5.29
“Evidence on the effect of entering Medicare from employer-sponsored coverage shows that, at age 65 years, Medicare enrollment leads to decreased health care spending by about 30% without changes in utilization; virtually all of this reduction is related to lower prices for services—that is, Medicare reimburses physicians and hospitals less than private insurance. Therefore, the policy would increase public spending by replacing some of today’s private spending with federal dollars, although notably at lower prices. Given that approximately 20 million people between the ages of 60 and 64 years have commercial insurance, have Medicaid, or are uninsured, and per-capita spending for this age group would average about $5000 per year in Medicare, total Medicare spending for these 20 million new beneficiaries could amount to as much as $100 billion per year.
[..] The policy would have several other important and countervailing effects. First, for the commercially insured population, lowering the Medicare eligibility age to 60 years would allow the oldest and highest-spending 5-year age band of enrollees to exit the private insurance pool. This would not only reduce employer and insurer medical costs for these individuals but could also make average spending among the remaining enrollees 60 years and younger lower, which could reduce employer premiums for those workers and reduce enrollee premiums in the employer and nongroup insurance markets. Fewer enrollees and a healthier risk pool in the ACA Marketplace would also decrease government subsidies for these plans, especially for 60- to 64-year-olds who have higher premiums and tax credits at baseline. These savings would help offset the new federal spending for them in Medicare.
[..] A 2018 analysis by the Congressional Budget Office of a mirror-image proposal (ie, raising the Medicare eligibility age from 65 to 67 years) estimated that 60% of the federal savings to Medicare and Social Security attributable to removing this 2-year age band from Medicare would be offset by increased federal spending on subsidies in the ACA Marketplaces and on Medicaid. If a similar offset holds for lowering the age of eligibility, then the federal costs for lowering the eligibility age to 60 years could be as low as $40 billion a year for the 20 million new Medicare beneficiaries. If the offset is smaller in reverse, in part because the share of people aged 60 to 64 years in Medicaid today (source of savings) is less than the share of Medicare beneficiaries aged 65-67 years predicted to go to Medicaid (source of costs) under the mirror image proposal, then the federal costs would be higher than $40 billion. This does not account for the increased Social Security spending or additional federal tax revenues above, which are likely to be several billion dollars each.
[..] the policy may disproportionately benefit disadvantaged populations whose insurance options before age 65 years are less generous than Medicare. Moreover, physicians and hospitals would face a reduction in prices for services previously reimbursed at commercial insurer rates that would be reimbursed at Medicare rates. To the extent that the price reduction induces clinician behavioral responses—such as changes in quantity of services, coding intensity, site of care, or patient selection (analogous to potential responses to a Medicare-for-All approach)—the fiscal outcome would be affected. Such responses would be important to anticipate and monitor from a quality-of-care perspective as well.”
Potential Implications of Lowering the Medicare Eligibility Age to 60, Song Z JAMA 2020.5.29
“As fewer patients are receiving in-person care due to COVID-19, it is difficult to attribute people to an ACO [accountable care organization], which is generally based on health care claims for primary care services. However, more patients are receiving telehealth services, which have not previously counted towards patient attribution.
[..] healthy people, who may have only one primary care visit in a year, would be less likely to be attributed to an ACO.
[..] the calculated annual per capita costs of the average ACO would increase as they would be responsible for a sicker population (as the healthier people who use few health care services are less likely to be attributed to them). This effect translates to a 1.06 percent increase for ESRD patients, a 1.60 percent increase for dual-eligibles, a 4.25 percent increase for disabled patients, and notably a 4.59 percent increase for aged, non-dual patients (by far the largest group of patients).
[..] CMS announced that certain telehealth services (as flagged by codes for virtual check-ins, e-visits, and telephone communications) will count towards beneficiary attribution to help make up for reduced face-to-face visits and keep patients safe at home.
[..] While attribution via telehealth is useful, there is a need to ensure that this doesn’t deepen disparities, especially due to the digital divide reflected in limited broadband in rural areas and data constraints for smartphones for low-income populations. Another challenge is that some more-advanced ACOs may be more likely to offer telehealth; therefore, patients who were previously part of another ACO (or unattributed to any ACO) may be attributed to these more-advanced ACOs. Furthermore, as noted earlier, healthy patients may forgo care altogether during the pandemic, creating another attribution challenge as the population of “assignable” patients may drop or become sicker on average.
[..] to assess potential unintended consequences of telehealth attribution, CMS should examine variations in telehealth uptake during COVID using current claims data (and recognizing claims data delays), in terms of outliers in patients’ use, physicians’ use, and ACOs’ use.
[..] there are several potential policy approaches to overcome them. If smaller or less technologically advanced ACOs have significantly lower attributed populations, CMS could use a 2-year attribution period instead of the current annual attribution, which would help average out changes in utilization due to COVID, such as using a different ACO due to telehealth capabilities. If ACOs with significant telehealth capabilities see significantly larger attributed populations, especially far from their traditional geographic service area, CMS could limit patient attribution for an ACO for 2020 to the counties where the ACO had attributed patients in 2019 (accounting for any changes in participating providers that might have expanded the ACOs’ service area).
Finally, CMS could also relax the current restrictions on changes to an ACO’s overall risk score during the pandemic to account for changes in the attribution population. Currently, individual ACO’s risk scores can go up only 3 percent per year and therefore may not fully account for a new population’s increased (or decreased) risk. However, this change itself could present a challenge, as it could encourage “upcoding” of patients to make them appear sicker than they really are. Alternatively, CMS could allow for risk scores of only COVID-19 patients to increase without a limit, adjusting for the pandemic while helping to mitigate the threat of upcoding. For ACOs with small populations of patients that are diagnosed with COVID-19, these patients could be excluded from risk-scoring.”
Leveraging Payment Reforms For COVID-19 And Beyond: Recommendations For Medicare ACOs And CMS’s Interim Final Rule, Crook HL et al. Health Affairs blog post, 2020.5.29
“Patient portals are one of the earliest investments in telehealth technology, yet uptake has lagged among underserved populations, including patients of racial/ethnic minority groups, limited English proficiency, low socioeconomic status, older age, and low literacy. [..] Similarly, mobile apps have not been designed for underserved populations.
[..] As the health care system and industry focus on digital expansion, broadband access could become a social determinant of health, which will dictate patient care experience. Beyond broadband, device access, whether via computer, tablet, or smartphone, is critical for patient engagement in a system that relies on mobile apps. Even though 81% of the US population owns a smartphone, there are gaps across literacy and socioeconomic status.
[..] First, federal, state, and local programs aimed at measuring and increasing broadband access should be expanded. Health care institutions can be involved by asking patients about their technology access as part of standard care. Second, the implementation of new digital health initiatives should include sociodemographic and literacy metrics. Third, the design of mobile app and patient portal interfaces should directly involve diverse patient populations and be inclusive of cultural, literacy, and linguistic needs. Fourth, federal equity mandates, such as the Culturally and Linguistically Appropriate Services standards, should be revised to provide guidance on how equity applies to digital health.”
Digital Health Equity as a Necessity in the 21st Century Cures Act Era, Rodriguez JA, Clark CR and Bates DW. JAMA 2020.5.28
2020.5.28
“A 2020 systematic review found several limitations of existing economic models for schizophrenia. Most existing models (83%) focused on antipsychotic medications, while there was a lack of models for nonpharmacologic interventions, such as cognitive behavioral therapy (CBT), family intervention, and crisis resolution and home treatment team (CRHT). Second, no antipsychotic medication was shown to be clearly cost-effective compared with the others because of inconsistent or even contradictory conclusions reported by different studies. Third, the quality of existing models was considered low. [..] A whole-disease model (WDM) represents a type of generic model that is unique in that it can be used to inform multiple resource allocation decisions across the entire care pathway.
[..] For each intervention under assessment, the consequences of treatment were grouped into the following 4 categories: clinical benefits (eg, preventing relapse), clinical harms (eg, adverse effects), costs (eg, cost of providing the intervention and treating its adverse effects), and cost savings (eg, reduced cost of treating relapse).
[..] In general, health economic models require 4 types of evidence, as follows: clinical evidence (baseline event risks, treatment effects and adverse events); health-related quality of life estimates (preference-based utility values); health care resource use; and costs.
[..] The base case analysis suggests that practice as usual plus CBT dominates practice as usual alone. The cost savings of CBT are substantial (£1243 [$1588] per person), likely because the evidence used to inform the WDM suggests that CBT can delay the transition from CHR-P to psychosis, and the treatment cost for individuals with psychosis or schizophrenia is much higher than the treatment cost for individuals at CHR-P. On the other hand, the QALY gains of CBT are marginal (5.19 × 10⁻⁵ per person), likely because evidence used in the WDM suggests that the utility for individuals at CHR-P is similar to individuals with psychosis. Assuming a willingness-to-pay (WTP) threshold of £20,000 ($25,552) per QALY gained, the probability that practice as usual plus CBT is cost-effective compared to practice as usual alone was estimated to be 0.96.
[..] The base case analysis suggests that a mix of CRHT and hospital admission produces the same QALY gains and additional cost savings (£3655 [$4670] per person) than hospital admission alone. This is because the evidence used to inform the WDM suggests equivalent effectiveness between hospital admission and CRHT,11 and the cost of hospital admission is much higher than the cost of CRHT services. Assuming a WTP threshold of £20,000 ($25,552) per QALY gained, the probability that a mix of CRHT and hospital admission is cost-effective compared with hospital admission alone was estimated to be 0.99.
[..] Assuming a WTP threshold of £20,000 ($25,552) per QALY gained, amisulpride is most likely to be cost-effective (0.39), followed by risperidone (0.30) and olanzapine (0.17). The probability of any antipsychotic medication being the most cost-effective option was less than 0.05.
[..] The base case analysis suggests that antipsychotic medication plus family intervention dominates both antipsychotic alone and family intervention alone. This is because the evidence used to inform the WDM suggests that family intervention can prevent relapse of psychosis, and the cost of treating relapse is much higher than the cost of family intervention. Assuming a WTP threshold of £20,000 ($25,552) per QALY gained, the probability that antipsychotic medication plus family intervention is the most cost-effective option compared with medication or family intervention alone was estimated to be 0.58.
[..] The base case analysis suggests that clozapine dominates all other antipsychotic medications. This is because the evidence used in the WDM suggests that, of the 5 antipsychotics assessed for individuals with TRS, clozapine was associated with the lowest all-cause discontinuation rate (including discontinuation due to inefficacy, intolerability, and nonadherence) and was less likely to cause acute extrapyramidal symptoms. Assuming a WTP threshold of £20,000 ($25,552) per QALY gained, the probability that clozapine is the most cost-effective option compared with other medications was estimated to be 0.81.
[..] The results of our analyses suggest that adoption of the following interventions could result in cost savings compared with the current service: practice as usual plus 16 sessions of CBT for individuals at CHR-P; a mix of hospital admission and CRHT for individuals with acute psychosis; antipsychotic medication (amisulpride, risperidone, or olanzapine) combined with 20 sessions of family intervention for individuals with FEP [first episode psychosis]; and clozapine for individuals with TRS [treatment-resistant schizophrenia]. Adoption of clozapine for individuals with TRS also resulted in additional QALYs. The results suggest that a brief family intervention (ie, 10 sessions) would not be cost-effective for individuals with FEP.”
Evaluation of the Cost-effectiveness of Services for Schizophrenia in the UK Across the Entire Care Pathway in a Single Whole-Disease Model, Jin H et al. JAMA Network Open, 2020.5.27
“This study investigated the association of differences in health care costs of patients with type 2 diabetes (T2D) with the introduction and use of an EHR system with an integrated disease management program (DMP). Cost categories included total health care, primary general practice, medication, nonhospital specialists, and hospital (total, outpatient, inpatient, and emergency). To our knowledge, no patient-level estimates of health care cost differences associated with use of an EHR/DMP for patients with diabetes have been published.
[..] the system required GPs to code patient visits (using the International Classification of Primary Care, version 2 standard) and also took other clinical information as inputs (eg, laboratory results, prescriptions). All patient visits to the GP [general practice] were meant to be coded in the registry. The system included disease management modules for specific groups of patients (eg, diabetes, coronary heart disease, chronic obstructive pulmonary disease, and anxiety and depression). The diabetes module included tracking of health measures, including glycated hemoglobin (HbA1c) levels, blood pressure, body mass index, cholesterol level, and albuminuria, with color-coded indicators to highlight where patients were missing targets. In addition, the system enabled GPs to observe their performance compared with peers across local, regional, and national levels. Examples of comparison metrics in the diabetes module included rates of patients receiving annual control visits, patients with HbA1c level greater than or equal to 53 mmol/mol (≥7.0%) who were receiving antidiabetic medications, and patients with systolic blood pressure greater than or equal to 140 mm Hg who were receiving antihypertensive medications.
[..] There was no association between EHR/DMP use and changes in annual total hospital (−0.8%; 95% CI, −7.5% to 5.7%) and total health care costs (−0.1%; 95% CI, −2.1% to 1.9%). There was a positive association between EHR/DMP use and annual treatment costs in general practice (3.2%, 95% CI, 0.9% to 5.6%) and a negative association with annual emergency hospital visit costs (–6.4%, 95% CI, –11.6% to –1.2%).”
Evaluation of an Electronic Health Record System With a Disease Management Program and Health Care Treatment Costs for Danish Patients With Type 2 Diabetes, Pulleyblank R, Mellace G and Olsen KR. JAMA Network Open, 2020.5.26
“We consider four designs for public plans that vary based on what rates providers are paid, whether the public option is implemented on the Health Insurance Marketplaces (or “Exchanges”) or off the Marketplaces, and whether premium tax credits are available to higher-income individuals.
The scenarios that we consider are as follows:
- public option off the Marketplaces, payment set at 79 percent of commercial rates [weighted average of Medicare and private rates that is 40% above Medicaid rates],
- public option on the Marketplaces, payment set at 79 percent of commercial rates,
- public option on the Marketplaces, payment set at 93 percent of commercial rates [estimate of the difference between the allowable rate for Washington state’s public option and current commercial rates in Washington state], and
- public option on the Marketplaces, payment set at 93 percent of commercial rates, tax credits available up to 500 percent of the federal poverty level (FPL).
[..] we assume that the public option for individual market insurance would offer bronze, silver, gold, and platinum tiers of actuarial-based coverage generosity. Furthermore, we assume that the public option is part of the individual market, that is, part of a single risk pool with other individual market plans and risk adjustment between plans. In this report, we refer to other individual market premiums as “private” individual market premiums. The public option could be offered as government-run health plans or government-sponsored health plans by contracted insurers that are subject to government oversight over provider payment rates and other standards.
[..] Across the scenarios that we considered, public option premiums were between 10 and 27 percent lower than private individual market premiums. Most of the difference in premiums was attributable to lower provider payment rates in the public option. In addition, we assumed that sicker and more expensive people would tend to prefer private plans, due to
perceived or actual concerns about provider access on the public option.
[..] Most individual market enrollees switched from private to public plans. A relatively small pool of more expensive people remained enrolled in private plans, due to our assumption that higher spenders would have a lower preference for public plans because of real or perceived access barriers related to lower provider payment.
[..] In all scenarios, federal spending on APTCs [advance premium tax credits] fell with the introduction of the public option, with savings ranging from $7 to $24 billion. The reduction in federal APTC spending was driven by changes in the benchmark premium used to set tax credit amounts. In scenarios 2, 3, and 4, we assumed the public silver option, which pays lower rates, would become the benchmark premium. The benchmark premium also fell in scenario 1, due to downward pressure from competition and reductions in CSR [cost-sharing reductions] loading.
[..] The addition of the public option had complex effects on the health insurance market, adding a more affordable option for some individuals while increasing the cost of existing private options and reducing APTCs.
[..] The public option is substantially cheaper than private health insurance and hence reduces federal spending on tax credits relative to current law. Effects for enrollees, however, are more mixed. The tax credit structure of the Affordable Care Act (ACA) was intentionally designed to insulate enrollees from fluctuations in premiums. Specifically, tax credits are based on the cost of a benchmark silver plan minus an income-based required contribution. When the benchmark
premium increases, this tax credit structure serves as a “shock absorber,” allowing people to retain coverage without experiencing significant changes in out-of-pocket costs. However, when the benchmark premium falls, tax-credit-eligible individuals may not experience a reduction in their health insurance costs, because their tax credit declines as well. The lack of savings for currently subsidized enrollees dampens the effect of the public option on health insurance enrollment,
particularly in scenarios where the public option becomes the benchmark plan. Further, lower-income people are less likely to benefit from the public option than higher-income people. This is because higher-income people who pay the full cost of insurance out of pocket can receive a substantial reduction in costs when the public option is available, while lower-income people may receive lower tax credits that may outweigh the accompanying change in premiums.”
Public Options for Individual Health Insurance: Assessing the Effects of Four Public Option Alternatives, Liu JL et al. RAND Corporation, 2020.4.20
“Hospital selection can be a major factor in survival for a patient with cancer. Receiving complex cancer treatment from an insufficiently prepared hospital (eg, adequate experience, specialty trained surgeons) can expose a patient to a 4-fold increase in risk of death from surgical complications. Cure rates after cancer treatment are similarly variable, and several hospital characteristics (eg, higher volume hospitals, affiliation with a medical school) are associated with superior long-term survival. Therefore, patients with cancer have a critical need for information regarding the safety and quality of hospital care.
[..] Hospitals that were ranked as being in the top 50 cancer hospitals by USNWR [US News and World Report] at least once between 2013 and 2016 were eligible to be analyzed as the top-ranked cohort. The USNWR rankings were chosen because they are widely recognized by the public, have been shown to influence patient choice, and potentially have the highest correlation with quality among publicly available indicators. Of note, there is approximately 75% concordance between designation by National Cancer Institute, and the USNWR top 50 cancer hospital status. Brand-sharing affiliates of top-ranked hospitals were identified as hospitals that (1) were affiliates of 1 of the top-ranked hospital in the American Hospital Association’s annual survey and (2) included the name of the top-ranked hospital (ie, the top-ranked hospital’s brand) in their web presence
[..] The complex surgical procedures to treat cancer included colectomy (total or partial), proctectomy, esophagectomy, pulmonary lobectomy, pneumonectomy, pancreaticoduodenectomy (Whipple), gastrectomy (total or partial), and cystectomy.
[..] we wanted to focus on procedures with an operative mortality that exceeded 2%, a metric previously described as an indicator of high-risk cancer treatment. At the same time, we wanted to consider procedures involving different anatomic regions, and thus likely different surgical teams. Combined, the studied procedures represent more than 80% of complex cancer treatments in the US and are similar to those that have previously been studied as complex cancer treatments.
[..] A total of 56 top-ranked hospitals and 206 affiliates were included in analysis.
[..] Time ratios (TRs) were reported to represent relative total survival time for patients at affiliate hospitals compared with those at top-ranked hospitals.
[..] The adjusted 90-day mortality risk for all procedures combined was statistically significantly higher at the affiliates compared with the top-ranked cancer hospitals (OR, 1.67 [95% CI, 1.49-1.89]). The adjusted 90-day mortality risk varied by procedure from proctectomy (OR, 1.23 [95% CI, 0.78-1.96]), to total colectomy (OR, 2.72 [95% CI, 1.57-4.72]).
[..] In adjusted analyses [..], patients treated at affiliate hospitals experienced statistically significantly less survival time compared with patients treated at top-ranked hospitals (TR, 0.77 [95% CI, 0.72-0.83]) [3-year survival].
[..] A sensitivity analysis that excluded mortality within 90 days of surgical treatment (ie, only included patients who survived beyond the perioperative period) also demonstrated lower survival at affiliates (pooled TR, 0.87 [95% CI, 0.82-0.92].
[..] The top-ranked hospitals performed more than 2-fold the annual volume of affiliate hospitals, which is potentially important because higher surgical volumes have been associated with advantages in surgical mortality, and long-term survival. However, sensitivity analyses demonstrated that differences in surgical volume did not fully explain the differences in survival. That is, while volume adjustment did mitigate a portion of the differential (ie, narrowed margin between affiliates and top-ranked hospitals, with some procedures losing significance), the overall finding of inferior survival at affiliates remained. This is consistent with our findings when volume was included in our Medicare database study. It should be noted that our study was not designed to explain the etiological origin of the differential, simply to assess the magnitude of the differential. We recognize that for some procedures in some networks, the optimal survival may require lower volume hospitals to stop performing certain operations.
Survival After Cancer Treatment at Top-Ranked US Cancer Hospitals vs Affiliates of Top-Ranked Cancer Hospitals, Boffa DJ et al. JAMA Network Open, 2020.5.26
2020.5.27
“more than half the residents of this [Washington state] skilled nursing facility (27 of 48) who had positive tests were asymptomatic at testing. Moreover, live coronavirus clearly sheds at high concentrations from the nasal cavity even before symptom development.[..] Symptom-based screening alone failed to detect a high proportion of infectious cases and was not enough to control transmission in this setting.
[..] Despite “lockdowns” in these facilities, coronavirus outbreaks continue to spread, with 1 in 10 nursing homes in the United States (>1300 skilled nursing facilities) now reporting cases, with the likelihood of thousands of deaths. Mass testing of the residents in skilled nursing facilities will allow appropriate isolation of infected residents so that they can be cared for and quarantine of exposed residents to minimize the risk of spread.[..] Routine rRT-PCR testing in addition to symptomatic screening of new residents before entry, conservative guidelines for discontinuation of isolation, and periodic retesting of long-term residents, as well as both periodic rRT-PCR screening and surgical masking of all staff, are important concomitant measures.
[..] There are approximately 1.3 million Americans currently residing in nursing homes.
[..] This recommendation for SARS-CoV-2 testing of asymptomatic persons in skilled nursing facilities should most likely be expanded to other congregate living situations, such as prisons and jails [..], enclosed mental health facilities, and homeless shelters, and to hospitalized inpatients.”
Asymptomatic Transmission, the Achilles’ Heel of Current Strategies to Control Covid-19, Gandhi MG et al. NEJM 2020.5.28
“Chatbots are software programs that talk with people through voice or text in their natural language. Some well-known examples include “Alexa” from Amazon, “Siri” from Apple, and “Cortana” from Microsoft. They often come pre-installed on smartphones or home-based smart speakers5. In recent years, chatbot use for health-related purposes has increased considerably, from supporting clinicians with clinical interviews and diagnosis to aiding consumers in self-managing chronic conditions6. While promising, the use of chatbots may pose safety risks. Chatbots have varied widely in their responses to questions about physical health, suicide, intimate partner violence, substance abuse, and other sensitive conversations. In one study, about a third (29%) of chatbot responses to health questions could have caused harm, and about half of those (16%) could have resulted in death if acted upon. The COVID-19 pandemic puts in stark relief the potential for chatbots to help save lives.
[..] Because chatbots provide a single answer to most questions, they are able to present concise information from credible sources, which may be less overwhelming than social media or web search engines’ long list of results. This matters because false news spreads online both faster and further than accurate news. Chatbots, in contrast to newspapers and online information sources, can often hear and respond in natural language, improving access for people who cannot read or have difficulty using the internet. They can be available any time of the day to answer questions with up-to-date information, and unlike human experts, can concurrently speak with millions of people at the same time in local languages and dialects.
[..] Chatbots could fill the gap between knowledge and action through repetition, step-by-step instructions, and by suggesting “tips and tricks” for behavior change (e.g., self-enactable behavior change techniques). In a study of low health literacy patients in a hospital setting, 60% requested additional health information from a chatbot at discharge. In a pandemic, chatbots could offload time-consuming but important behavioral support and instruction from human healthcare workers. Home-based chatbots, like the ones on devices from Amazon, Apple, and Google, may support behavior change by linking users to third-party voice apps through “skills” or “actions.” These additional capabilities allow chatbots to provide services and share information beyond their native programming.”
Chatbots in the fight against the COVID-19 pandemic, Miner AS et al. npj Digital Medicine. 2020.5.4
“The HSA [Health Security Act] would create a state-administered health insurance plan (“Health Security Plan”), with the goal of providing universal health insurance coverage and access to affordable, high-quality health coverage for all state residents. [..] The objective of the analysis is to assess, over a 5-year period, the cost of the proposed Health Security Plan (HSP) and whether existing revenue and potential savings from the plan would be sufficient to cover its cost.
[..] We used a microsimulation model to estimate the effects of HSP on health insurance coverage and spending from 2024 (assumed initial year of the HSP) through 2028. We developed a baseline projection for the study period, which reflected health care coverage and spending under current law. We then compared the baseline to projected outcomes under the HSP.
[..] In our model, a key driver of savings would be reduced state administrative costs. The 2019 HSA would limit administrative costs of the HSP to no more than 5 percent of total spending starting in the sixth year. We assume that administrative costs represent 9 percent of total HSP spending in 2024 and fall to 5 percent by 2028. Our assumed administrative cost levels represent significantly lower costs as a percentage of total spending than is currently achieved by the state Medicaid program or by the national Medicare program. Spending on administrative costs accounted for roughly 12.4 percent of total New Mexico Medicaid spending in 2017. According to the National Health Expenditure Accounts from the Centers for Medicare & Medicaid Services, administrative costs accounted for approximately 7 percent of Medicare spending. Thus, the state may find it challenging to achieve a 5-percent administrative cost factor, without compromising some aspect of the program.
[..] If implemented, the Health Security Act would be the most ambitious state-based health reform ever carried out in the United States. Under the HSP, the state’s uninsured rate would likely fall well below 1 percent and the vast majority of the population would receive coverage through a public insurance program. The plan would also improve health care affordability for low- and middle-income families that would otherwise receive coverage through the non-group market. Over the initial 5-year period, the overall economic impact of the HSP is expected to be small. However, the role for private insurance would be diminished, and some segments of the private insurance market would likely disappear altogether. As a result, HSP could produce financial hardship to New Mexican families and businesses associated with the private insurance industry. Usage of health care services would increase, but long-term total health care spending could fall if reductions in payer-side administrative costs are achieved to the level specified in the Health Security Act. Most of the cost of the HSP could be financed by redirecting public funding from duplicative health programs, requiring contributions from employers not offering coverage, and requiring enrollees with the means to pay a portion of their own premium costs. Still, significant additional funding sources would likely be needed to fully cover the cost of the plan.
[..] two critical success factors for the HSP. The state’s consolidated purchasing power under the HSP in the form of reduced administrative expenses and negotiated medical and pharmacy discounts means a $4 billion difference in program costs.
Fiscal Analysis of New Mexico’s Health Security Plan: Preliminary Report, Prepared for New Mexico Legislative Finance Commitee. KNG Health Consulting, LLC; IHS Markit; Reynis Analytics. 2022.5.22
“With the right combination of usability, validity, security, and privacy, we believe health apps can be beneficial, and even potentially transformational for health and health care. However, tools to address these and other dimensions are not widely used, and routine ratings addressing these dimensions are not available resulting in a lack of information to make informed decisions on which apps to use or recommend. As a step toward addressing this issue, we developed and preliminarily assessed a rating tool to objectively assess the risks and benefits of health apps.
Detailed app rating criteria
- Transparency
- App cost
- Consent
- Accuracy of app store description
- Health content
- Appropriate measurement
- Appropriate interpretation of data
- Quality of information
- Potential for harm
- Literacy level
- Presentation of information
- Technical content
- Software performance/stability
- Interoperability
- Bandwidth
- Application size
- Security/privacy
- Protection against theft, virusus, etc.
- Authentication
- Data sharing
- Maintenance
- Signaling of breaches
- Anonymisation
- Usability
- Installation and setup
- Functionality
- Aesthetics
- Customization/tailoring
- Ease of use for users with low literacy and numeracy
- Available in multiple languages
- Subjective rating (Would you recommend this app?)
“When we used the tool to assess an array of chronic disease apps, we found that their performance was mediocre overall, and they received strikingly low marks on security/privacy, consent, and interoperability. [..]
[..] an enormous turnover of apps occurred between our prior work 2 years ago and 2018 (of the 137 category 1 apps evaluated in our prior study, only 37 were still available or met criteria). Even during the rating process (5 months), some apps became unavailable in the app store. This calls into question the sustainability of apps as they are being developed today. Another concern is whether they could cause harm because of their availability which is typically short-term, akin to prescribing medicine or using a medical device only available for a few months yet is expected to be available for years.
[..] Traditional app store star ratings poorly correlated with our tool’s rating. This could be because a single item does not capture all the dimensions involved in a tool such as this, or because some users do not value issues such as security/privacy or interoperability, or even because some of the ratings are not supplied by actual users. While star ratings work quite well for issues like restaurants or hotels, and they have been found to correlate well with traditional quality rankings in healthcare, they may not be sufficient for apps.
[..] the Food and Drug Administration has created a “precertification” program for mobile apps, and it is intended to update the regulatory framework enacted by Congress some years ago targeting hardware. The prior framework has not worked well with software which changes frequently. The “precert” program is intended to consider these rapid changes. However, its main target so far appears to be the robustness of the software which is being developed. It has not included to date an approach to enable third-party assessments of apps, which seems to be a key need in the marketplace. Moreover, there is no focus so far to make sure the apps make a difference—that is to say, are usable by patients and change health outcomes.”
Design and testing of a mobile health application rating tool, Levine DM et al. NPJ Digital Medicine, 2020.5.21
2020.5.26
“Several groups—including the Guidelines International Network—seeking to accelerate evidence synthesis through collaborations set out to define standards for computable expressions of evidence, statistics, and evidence variables. In 2018, we started a project through Health Level Seven International (HL7®) to extend the Fast Healthcare Interoperability Resources (FHIR®) standard to achieve this. The group is called Evidence-Based Medicine on FHIR (EBMonFHIR). In less than two years, the EBMonFHIR project established draft standards for expression of Evidence (http://build.fhir.org/evidence.html), Evidence Variables (http://build.fhir.org/evidencevariable.html), Statistics (http://build.fhir.org/statistic.html) and Ordered Distributions for statistical arrays (http://build.fhir.org/ordereddistribution.html).
[..] our group initiated the COVID-19 Knowledge Accelerator (COKA, https://www.gps.health/covid19_knowledge_accelerator.html). The specific strategy of COKA is to establish universal standards for each component of knowledge exchanged and thus enable stakeholders to share and re-use their efforts by using the same format for electronic data exchange.
As of May 11, 2020, COKA had 50 working meetings with more than 40 active participants from more than 25 organizations from academia, industry, government, and nonprofits in seven countries. The group has created additional draft FHIR standards for expressions of Citations (http://build.fhir.org/citation.html) and Evidence Reports
(http://build.fhir.org/evidencereport.html) that provide compositions of all the preceding concepts.
[..] Computable evidence synthesis is not the endpoint but rather another step in a larger knowledge ecosystem. For instance, the EBMonFHIR project is closely related to a CPGonFHIR project (http://build.fhir.org/ig/HL7/cqf-recommendations/) extending FHIR to support clinical guidelines. Past and present consortia efforts that have or are considering advancements for this ecosystem include the AHRQ evidence-based Care Transformation Support initiative (ACTS, https://digital.ahrq.gov/acts), Logica (https://covid-19-ig.logicahealth.org/), Mobilizing Computable Biomedical Knowledge (MCBK, http://mobilizecbk.org/), and the Patient-Centered Clinical Decision Support Learning Network (PCCDS LN, https://pccds-ln.org/).”
IT IS TIME FOR COMPUTABLE EVIDENCE SYNTHESIS, Richardson JE et al. Journal of American Medical Informatics Association, 2020.5.22
“Larger hospitals typically have on-call stroke teams that quickly assess patients with suspected stroke; patients receiving care at hospitals without this expertise may be less likely to receive appropriate treatment. Telestroke has emerged as a potential solution by which remote stroke experts guide local emergency physicians through the neurological examination, review of imaging, and management decisions.
[Methods] This is a convenience sample and does not capture all telestroke sites and most likely underrepresents smaller networks.
[Results] By 2019, 1306 of 4751 hospitals (27.4%) had telestroke capacity. Uptake grew slowly and peaked in 2014.
[Discussion] Smaller, rural, and critical access hospitals, the group of hospitals that might benefit most from telestroke, are relatively less likely to have adopted this technology. It is unclear what barriers these hospitals face in introducing telestroke capacity. Potential barriers include lack of capital investment, lack of high-speed internet in rural communities, and regulatory barriers (eg, Stark Laws limit the material support that can be provided to referring hospitals).”
Assessment of Telestroke Capacity in US Hospitals, Richard JV et al. JAMA Neurology, 2020.5.26
“[Methods] We used data from the National Health and Aging Trends Study (NHATS), a nationally representative sample of Medicare beneficiaries. [..] We assessed the incidence of becoming homebound based on patient or proxy response to this question: “In the last month, how often did you leave your home/building to go outside?” Homebound individuals were defined as those who reported leaving home never or rarely (≤1 day/week).
[Results] Among 35 million previously nonhomebound community-dwelling Medicare beneficiaries, we estimated that 12.7% became homebound over the 7-year study period. [..] Each year, the risk of becoming homebound (range, 1.8%-3.1%), was greater than the risk of becoming a nursing home resident (range, 0.3%-1.0%). Over the study period, we estimated about 4.5 million in the population studied became homebound, 1.2 million moved to a nursing home, and 8.3 million died.
[..] 39.1% of incident homebound individuals had 5 or more chronic conditions and 28.6% had probable dementia, compared with 35.4% and 44.8%, respectively, for incident nursing home residents. In addition, 42.9% of those who became homebound had annual incomes in the lowest quartile (below $16,668) and 38.5% lived alone.
[Discussion] older adults in the US were more likely to become homebound than to move to a nursing home.
[..] Our findings highlight the importance of assuring that homebound patients and their families have access to needed care to remain safely in the community, including paid caregivers, home-based services (eg, meal delivery), telehealth, portable medical equipment, and the expansion of home-based medical care.”
Estimation of the Incident Homebound Population in the US Among Older Medicare Beneficiaries, 2012 to 2018, Ornstein KA et al. JAMA Internal Medicine, 2020.5.26
“[Methods] The Polish Colonoscopy Screening Program database includes integrated colonoscopy and histopathology results, with mandatory reporting of the following quality indicators: cecal intubation, bowel preparation adequacy, and the endoscopist’s annual ADR [adenoma detection rate]. The records are verified annually for completeness by external auditors.
Cecal intubation was defined as passage of the colonoscope tip to a point proximal to the ileocecal valve and complete visualization of the whole cecum and its landmarks. Bowel preparation adequacy was reported by using the Aronchick Scale. The endoscopist’s annual ADR was defined as the proportion of screening colonoscopies with adenoma detection. Colonoscopies were categorized as high-quality if they met all of the following criteria: cecal intubation, adequate bowel preparation (very good, good, or sufficient), and endoscopist ADR of 20% or greater calculated on a yearly basis (the suggested quality threshold at the time of examination).
[Results] Among 276 372 individuals screened over the study period, 110,485 (40.0%) were excluded owing to nonnegative colonoscopy (48,533 [17.6%]), lack of histopathology results or incomplete polyp removal (1743 [0.6%]), suspicion or diagnosis of hereditary cancer syndrome (95 [<0.1%]), age outside of the screening age range (742 [0.3%]), incorrect personal identification number (9923 [3.6%]), examination by an endoscopist who performed fewer than 30 screening colonoscopies per year (8632 [3.1%]), or family history of CRC [colorectal cancer] (40,798 [14.8%]). We also excluded 19 individuals who were diagnosed with CRC within 6 months after screening colonoscopy, of whom 12 were suspected to have CRC at baseline examination.
[..] Screening colonoscopies in the analyzed cohort were performed by 505 different endoscopists. [..] In the cohort, 113,513 individuals had low-quality colonoscopy and 52,374 had high-quality colonoscopy.
[..] in multivariate analysis, the risk for CRC was significantly lower among individuals who had high-quality colonoscopy than those who had low-quality colonoscopy. Hazard ratios for CRC after high-quality colonoscopy remained stable throughout the entire follow-up.
[..] We also assessed how ADR cutoff points of 15%, 25%, and 30% influence CRC incidence and mortality. Overall, there was no substantial difference in the obtained SIRs [standardized incidence ratios] and SMRs [standardized mortality ratios] compared with the 20% ADR reference used in our study.
[Discussion] The results of this large population-based study demonstrated that persons with a single screening colonoscopy with a negative result had significantly reduced CRC incidence and mortality over the following 17.4 years. The reduction rates for the period beyond the currently recommended 10-year interval (10 to 17.4 years) did not significantly differ from those in the earlier observation periods. This was mainly driven by long-lasting reductions in CRC incidence and mortality (by 84% and 90%, respectively) after high-quality screening colonoscopies. High quality was key for the profound long-term efficacy of screening colonoscopy in the proximal colon, and among women. These findings are of paramount importance, because previous reports have questioned the efficacy of colonoscopy in the proximal colon and of screening sigmoidoscopy in women.
[..] Each component of high-quality examination—cecal intubation, adequate bowel preparation, and ADR of 20% or greater—contributed to the observed colonoscopy efficacy, with ADR being most important. Of note, use of ADR cutoffs of 15% to 30% did not substantially change our main findings.”
Long-Term Colorectal Cancer Incidence and Mortality After a Single Negative Screening Colonoscopy, Pilonis ND et al. Annals of Internal Medicine. 2020.5.26
“Today, one in every nine people in the world is hungry, and one in every three is overweight or obese. More and more countries experience the double burden of malnutrition, where undernutrition coexists with overweight, obesity and other diet-related non-communicable diseases (NCDs).
[..] First, we must address inequities in food systems, from production to consumption. Current food systems do not enable people to make healthy food choices. The vast majority of people today simply cannot access or afford a healthy diet.
[..] Second, we must address nutrition inequities in health systems. Malnutrition in all its forms has become the leading cause of ill health and death, and the rapid rise of diet-related NCDs is putting an intolerable strain on health systems. Yet, most people cannot access or afford quality nutrition care for prevention or treatment.
Global progress toward 2025 global nutrition targets (against the 2012 baseline)
- Anemia – 50% reduction of anemia in women of reprodutive age (off-course)
- Exclusive breast feeding – increase the rate of exclusive breastfeeding in the first six months up to at least 50% (some progress)
- Low birth weight – 30% reduction in low birth weight (some progress)
- Childhood stunting – 50% reduction in the number of children under 5 who are stunted (off course)
- Childhood wasting – reduce and maintain childhood wasting to less than 5% (off course)
- Childhood overweight – no increase in childhood overweight (off course)
- Salt intake – 30% relative reduction in mean population intake of salt/sodium (off course)
- Raised blood pressure – 25% relative reduction in the prevalence of raised blood pressure or contain the prevalence of raised blood pressure, according to national circumstance (off course)
- Adult obesity – halt the rise in prevalence (off course)
- Adult diabetes – halt the rise in prevalence (off course)
“[Methods] Inclusion criteria were an untreated systolic blood pressure on screening of 120 to 135 mm Hg, an untreated diastolic blood pressure on screening of 75 to 85 mm Hg, a body mass index of at least 25 kg/m2, and a first-degree relative with hypertension before age 60 years. The study excluded patients with morbid obesity, poorly controlled diabetes, renal or cardiovascular disease, active cancer, use of opioids or glucocorticoids, or pregnancy.
[..] If applicable, antihypertensive medications were systematically withdrawn over 2 to 12 weeks to minimize confounding of renin and aldosterone measurements, such that all study assessments were done in an untreated state. The exception to this was the Resistant Hypertension Clinic protocol, where participants stopped receiving mineralocorticoid receptor antagonists and epithelial sodium-channel inhibitors 6 weeks before study assessments, but other antihypertensive medications were continued for safety.
[..] all participants were prescribed a high-sodium diet and standardized potassium intake for 5 to 7 days before completing a 24-hour urine collection and measurement of blood pressure and circulating levels of renin, aldosterone, and electrolytes.
[..] The oral sodium suppression test consists of an oral sodium load, with the goal of achieving a 24-hour urinary sodium balance of at least 180 to 200 mmol, to induce expansion of intravascular volume and physiologic suppression of renin and angiotensin II. Given the unreliability of single measurements of circulating aldosterone due to variable and pulsatile secretion in primary aldosteronism and high-sodium states, 24-hour urinary aldosterone excretion was used as a consistent and integrated measurement of renin-independent aldosterone production.
[..] Renin-independent aldosterone production is categorized as “biochemically overt primary aldosteronism” when it exceeds the international diagnostic threshold, an aldosterone excretion rate of at least 12 µg/24 h in the context of both high sodium balance and suppressed renin activity.
[Results] Of the 1846 participants with complete data for aldosterone, renin, and urinary sodium, 1015 had a rate of urinary sodium excretion of at least 190 mmol/24 h. A subset of 691 had suppressed renin activity and were eligible for the assessment of the magnitude of renin-independent aldosterone production.
The study population included 289 untreated normotensive participants, 115 with untreated stage 1 hypertension, 203 with untreated stage 2 hypertension, and 408 with resistant hypertension who were receiving antihypertensive treatment.
[..] A continuum of renin-independent aldosterone production was observed to parallel the severity of hypertension, whereby despite a high sodium balance and suppression of renin, 24-hour rates of urinary aldosterone excretion ranged from the lower bounds of detection to values exceeding the diagnostic threshold for primary aldosteronism. Findings were similar by study site. Although the categorical diagnostic threshold of 12 µg/24 h is recommended to designate those with and without primary aldosteronism, the magnitude of renin-independent aldosterone production was progressively higher across blood pressure categories, regardless of this arbitrary designation.
[..] Among participants confirmed to have biochemically overt primary aldosteronism, the sensitivity and negative predictive value of the ARR [aldosterone-renin ratio] were poor, which highlights the limitations of this diagnostic ratio in screening for—and excluding—true cases of primary aldosteronism. Similarly, among participants with resistant hypertension, where the pretest probability of primary aldosteronism is high, 24.5% of confirmed case patients (24 of 98) had a serum aldosterone concentration less than 277 pmol/L (10 ng/dL), a threshold below which the diagnosis of primary aldosteronism is almost never entertained.
[Discussion] Our current findings provide the mechanistic underpinnings to refine these epidemiologic observations and suggest that the distinction between “biochemically overt primary aldosteronism” and “renin-independent aldosterone production” is an arbitrary construct limited to identifying the most severe primary aldosteronism. Because primary aldosteronism and mineralocorticoid receptor activation are modifiable mechanisms of cardiovascular risk, reframing the terminology to indicate that primary aldosteronism is a syndrome of renin-independent aldosterone production that is prevalent across the entire continuum of human blood pressure may be necessary to raise awareness, increase diagnosis rates, and promote targeted treatment interventions.
[..] suppressed renin is a biomarker that identifies patients who are more likely to have primary aldosteronism and may especially benefit from mineralocorticoid receptor antagonists. For these patients, clinicians should first strongly emphasize the importance of dietary sodium restriction, not only as a general intervention to improve blood pressure but also as a targeted maneuver to minimize the fuel that feeds primary aldosteronism pathophysiology. In addition, and when resources permit, more definitive (and laborious) physiologic testing may be done to confirm the diagnosis and to consider whether a surgical intervention might be warranted. At minimum, clinicians should consider prescribing mineralocorticoid receptor antagonists more liberally for hypertensive patients with suppressed renin.”
The Unrecognized Prevalence of Primary Aldosteronism: A Cross-sectional Study, Brown JM et al., Annals of Internal Medicine, 2020.5.26
“[Executive Summary] More Americans could lose their lives to deaths of despair, deaths due to drug, alcohol, and suicide, if we do not do something immediately. Deaths of despair have been on the rise for the last decade, and in the context of COVID-19, deaths of despair should be seen as the epidemic within the pandemic. The goal of this report is to predict what deaths of despair we might see based on three assumptions during COVID-19: economic recovery, relationship between deaths of despair and unemployment, and geography. Across nine different scenarios, additional deaths of despair range from 27,644 (quick recovery, smallest impact of unemployment on deaths of despair) to 154,037 (slow recovery, greatest impact of unemployment on deaths of despair), with somewhere in the middle being around 68,000. However, these data are predictions. We can prevent these deaths by taking meaningful and comprehensive action as a nation.
[Additional details] There is a relatively large body of literature examining the association between unemployment and all-cause mortality, as well as specific types of deaths. Work focused on suicides is the most established, showing that a one point increase in unemployment rates increases suicide rates by about 1 to 1.3% (Luo et al, 2011). This impact is shown to vary substantially with lower rates in countries with protective labor market policies (Norström and Grönqvist, 2015; Stuckler, et al, 2011; Reeves et al. 2012). Another study estimates that in the Great Recession a one point increase in unemployment increased suicides by 1.6% (Phillips and Nugent, 2014).
It’s important to note that the underlying causes that drive “deaths of despair” for all in America are multifaceted. They include social and individual-level factors such as isolation and loneliness; systemic issues such as a fractured health care system and lack of culturally and linguistically competent care; and finally community conditions such as systemic racism and structural inequalities in education, income, transportation and housing. These are further undergirded by a consistent lack of economic opportunity, stigma, and a combination of opportunity-limiting cultural and environmental factors in communities. Sadly, these factors impact some communities more than others in significant and consequential ways, especially racial and ethnic minority populations, people who are lower-income, or people who live in rural areas. Without attention to these issues, our nation will continue to drive an increase in health disparities.
[..] There are fewer studies that examine the association between unemployment on drug and alcohol deaths. A recent study (Hollingsworth et al, 2017) found that a 1 point increase in unemployment increased drug-related deaths by 3.3% (and 3.9% for opioid related deaths). Various studies show an association between joblessness and alcohol consumption (Booth and Feng, 2002; Mustard et al, 2013; Parsons and Barger, 2019; Browning and Heinesen, 2012), but the results are mixed. While overall alcohol consumption actually declined during the Great Recession (Cotti et al, 2012), binge drinking increased (Bor et al., 2013). To account for the potential additive impact of isolation and uncertainty on deaths of despair, we calculate a range of increase using 1.0%, 1.3% or 1.6% increase in deaths of despair for each point increase in the unemployment rate.”
Projected Deaths of Despair During the Coronavirus Recession, Petterson, Steve et al. Well Being Trust. May 8, 2020.
“The study, led by researchers in Argentina and published Monday in the journal PNAS, found that when female patients were excluded from or significantly underrepresented in the training data used to develop a machine learning model, the algorithm performed worse in diagnosing them when tested across across a wide range of medical conditions affecting the chest area. The same pattern was seen when men were left out or underrepresented.
[..] The researchers in Argentina focused on one of the most popular applications of AI in medicine: analyzing images to try to make a diagnosis. The systems they examined were tasked with analyzing an X-ray image of the chest region to detect the presence or absence of 14 medical conditions including hernias, pneumonia, and an enlargement of the heart.
[..] They set up five different training datasets featuring varying breakdowns: 100% images from female patients, 100% images from male patients, 75% images from female patients and 25% images from male patients, 75% images from male patients and 25% images from female patients, and a 50/50 split. (The researchers accounted for sample size by using the same number of images in each dataset.)
[..] Across medical conditions, the algorithms performed worse when tested in patients whose sex was underrepresented in the training data. And being overrepresented also didn’t seem to put either sex at an advantage: When the model was trained exclusively or mostly on women, it didn’t perform better when tested on women compared to when the training data were evenly split by sex.
[..] Companies have been built and academic careers devoted to finding technical ways to get around such challenges. A key first step, the researchers consulted by STAT said, is awareness of the limitations imposed by training datasets that are not representative. “We should communicate them, we should quantify them, and then we should work with clinicians and anyone who wants to use these algorithms to figure out a way to accommodate any of the limitations of artificial intelligence,” [PhD student at MIT’s Computer Science and Artifical Intelligence Lab Irene] Chen said.
The PNAS paper is the latest research to explore the impact of bias in algorithms meant for clinical use. In a paper posted on a preprint server earlier this year, a team led by researchers at the University of Toronto also examined chest X-ray data used to train diagnostic algorithms; they found that factors like the sex, age, race, and the insurance type of patients in that training data were associated with how well the models performed.”
AI systems are worse at diagnosing disease when training data is skewed by sex, STAT, 2020.5.25
2020.1.23
“Although partially electronic transactions often cost less and are less time consuming than manual transactions, there are savings opportunities associated with moving from partially electronic web portals to fully electronic transactions.
For the medical industry, $2.7 billion of the $9.9 billion total savings opportunity could be achieved by switching from partially electronic transactions to fully electronic transactions. The greatest per transaction savings opportunity for medical providers is prior authorization. Medical providers could save $2.11 per prior authorization transaction by using the federally mandated electronic standard rather than a web portal. Understanding the impact of portal use in more detail is important as the industry focuses on opportunities to decrease administrative costs and burden.
[..] The medical industry could save as much as $42.45 (including $29.27 for providers and $13.18 for plans) for a single patient encounter requiring all eight of the transactions tracked by using a fully electronic workflow. [..] The greatest per transaction savings opportunities associated with moving from a manual to a fully electronic transaction for the medical industry include prior authorization ($12.31), claim status inquiry ($7.72) and eligibility and benefit verification ($7.55).
[..] Savings also exist for transactions that are conducted using partially electronic web portals versus the fully electronic HIPAA standards. For example, medical providers could save, on average, $2.11 per transaction by completing a prior authorization using the HIPAA-mandated standard as opposed to a web portal.”
*CAQH suggested addressing these eight workflows to maximize savings:
- Prior authorization ($12.31/manual transaction to fully electronic and $2.11/partially electronic to fully electronic)
- Claim status inquiry ($7.72/manual transaction to fully electronic and [$0.12]/partially electronic to fully electronic)
- Eligibility and benefit verification ($7.55/manual transaction to fully electronic and $0.85/partially electronic to fully electronic)
- Attachments ($2.51/manual transaction to fully electronic)
2019 CAQH Index. Conducting Electronic Business Transactions: Why Greater Harmonization Across the Industry is Needed January 2020
2020.1.22
“Obesity is a widespread health condition, likely to be driven by the increased availability of inexpensive high-calorie food. People vary greatly in their behavioural response to food. Such variation is likely to be driven by behavioural styles, as behaviour accounts for overall food intake. A prominent hypothesis is that people with obesity respond to rewards similarly to people with addictions such as alcohol abuse or smoking. For instance, perceived overeating or ‘uncontrolled eating’ (UE) is the most common obesity-associated personality trait and resembles the perceived loss of control seen in drug addiction. Likewise, both obesity and addictive behaviours have similar correlations with broad personality domains. Here we seek to empirically test whether obesity and UE overlap behaviourally with addiction and psychiatric disorders, collectively referred to as phenotypes. We test for behavioural similarity by linking the personality profiles of each phenotype. NEO Personality Inventory profiles of 28 phenotypes were extracted from 22 studies, encompassing summary statistics from 18,611 unique participants. Obesity had moderate and UE high behavioural similarity with addictions. UE also overlapped behaviourally with most psychiatric phenotypes, whereas obesity was behaviourally similar with mood disorders and certain personality disorders. Facet-based phenotype profiles provided more information than domain-based profiles.”
Obesity has limited behavioural overlap with addiction and psychiatric phenotypes, Nature Human Behavior 2019.10.28
“For a policy-maker promoting the end of a harmful tradition, conformist social influence is a compelling mechanism. If an intervention convinces enough people to abandon the tradition, this can spill over and induce others to follow. A key objective is thus to activate such spillovers and amplify an intervention’s effects. [..] Even if conformity pervades decision-making, spillovers can range from irrelevant to indispensable. Our analysis highlights three considerations. First, ordinary forms of individual heterogeneity can severely limit spillovers, and understanding the heterogeneity in a population is essential. Second, although interventions often target samples of the population biased towards ending the harmful tradition, targeting a representative sample is a more robust way to achieve spillovers. Finally, if the harmful tradition contributes to group identity, the success of spillovers can depend critically on disrupting the link between identity and tradition.”
The promise and the peril of using social influence to reverse harmful traditions, Nature Human Behaviour 2019.12.2
2020.1.21
“The $3 trillion U.S. health care industry is underperforming, in part because of underpowered primary care. As a consequence, primary care physician resources are being squandered. These physicians spend a majority of their day on work that does not require a medical school education, such as order entry, prescription refills, visit note documentation, and being the first responder to the inbox. This dysfunctional practice model, coupled with disparities in payment for cognitive versus procedural work, drives trainees away from primary care. Those who choose primary care may reduce their patient contact hours as a coping strategy to manage the mismatch between work demand and work resources. By cutting patient contact hours while still working more than 40 hours per week, many of these physicians have in effect made the choice to work full-time hours for part-time pay.
With greater investment in practice science, it should be possible to discover more precisely how the practice environment affects the aims of health care. Big data and metrics of electronic health record use (9), such as Work Outside of Work, could advance our understanding of practice dynamics and panel capacity. How do Work Outside of Work and panel capacity vary by the size and skill level of the support staff and extended care team? How many patient contact hours result in a 40-hour workweek for a 1.0–full-time equivalent physician? (For that matter, how many hours are physicians expected to work each week?) How does this expectation and the support staff model affect recruitment and retention? All of these variables affect panel capacity, quality, and satisfaction. Another promising approach is to build on Milstein’s methods in “Uncovering America’s Most Valuable Care:” Identify practices with high quality, high satisfaction, and high panel capacity, and then dive deeper to discover key ingredients.
Rather than asking, “What is the ideal panel size in primary care?” we suggest reframing the question to “What is the ideal practice model that results in the best outcomes for the entire U.S. population?” We believe that a well-trained, well-resourced primary care team will make the most of society’s investment in these physicians’ training and will contribute to better experiences for patients and clinicians, lower costs, and better access to care.”
Optimal Panel Size: Are We Asking the Right Question?, Annals of Internal Medicine 2020.1.21
2020.1.16
“The change prototype was associated with changes in this search-and-discovery process by highlighting and organizing key prioritization details, ie, abnormal activity and change, into a concise visualization that supported fast interpretation and projection about the clinical status of a patient or group of patients. For example, patients who were clinically deteriorating were clustered on the upper-right side of the grid (ie, more change and more abnormal results), while those who had clinical improvements would tend to cluster in the lower right (ie, more change and fewer abnormal results). Therefore, once orientated to the design, physicians could quickly identify patients who were likely to be the most concerning by looking in the upper-right portion of the display, while patients in the lower-right portion would be less concerning.
This organization supports preattentive processing, ie, subconsciously recognizing visual patterns, by separating items based on location, resulting in rapid pattern recognition and data interpretation. Grouping the required data used during the clinical prioritization process simplified the interpretation of clinical data because the EHR performed some of the processing that has traditionally been done by physicians, resulting in reduced cognitive workload. Importantly, the visualization did not make specific recommendations but instead provided enough details and context to allow physicians to quickly recognize and process meaningful patterns without having to search the medical record and assemble the clinical picture by memory. Given that 76% of our participants preferred the change prototype [over the acuity view or problem view], this finding suggests that physicians are open to the EHR processing, organizing, and visualizing details that highlight clinically meaningful patterns. In addition, despite introducing a new and unfamiliar method of visualizing clinical data, the change design still had the lowest NASA TLX scores and highest usability scores of all 3 designs. This implies that novel systems should not avoid creating new kinds of visualizations if they successfully communicate clinically meaningful patterns and enhance physician decision-making.
[..] EHR systems have traditionally organized data into source-oriented (ie, where the data comes from, such as the laboratory, clinical notes, etc) or time-oriented (ie, data are primarily organized chronologically) views requiring physicians to search for and find the fraction of clinical details required to provide care. Concept-oriented views, in which data are organized and presented around clinical concepts, have the potential to greatly reduce the cognitive workload associated with EHR use. Each of our 3 prototypes was a different concept-oriented view based on the 3 patient characteristics used during the prioritization process, ie, acuity, clinical problems, and change. Given that physicians typically search for information to help them accomplish a specific clinical task (eg, prescribing medications), well-designed concept-oriented views could provide all the required data elements in a single location to support the task’s successful completion. For example, a concept-oriented medication list would provide relevant data elements associated with each medication, such as laboratory test results, physical examination findings, dosage changes, adherence data, etc, in a single location within the EHR, allowing a physician to quickly understand a patient’s response to therapy without having to search multiple EHR sections. Ahmed et al demonstrated that a novel EHR interface that reduces extraneous details and organizes details via concept-oriented views based on grouped lists of text and/or numerical data was associated with a reduction in the cognitive workload of physicians in intensive care units compared with a traditional EHR. Our work extends their findings by demonstrating that well-designed concept-oriented views that leverage information visualization, a method of communicating data visually to support fast, efficient, and accurate interpretation, were also associated with reductions in the cognitive workload.
The ability to reduce the cognitive workload through concept-oriented information visualization depends on achieving the appropriate balance between presenting clinically meaningful patterns as discrete and fully contained visualizations with the need for physicians to search, identify, and remember the details required to identify and validate the same patterns. The structure of the acuity and problem prototypes likely led to clinicians searching through additional details to provide insight into the overview visualizations, which may have been a factor in increasing the cognitive workload for our participants when compared with the change prototype. The need to spend more time searching likely explained why the acuity view had the highest concordance between the first and final ranking tasks of the 3 prototypes. With data spread across the most pages in the acuity prototype, participants likely relied on the overview visualization to form their clinical impressions because they may have found searching for the confirmatory details burdensome and overwhelming. This study provides additional evidence that designing concept-oriented visualizations requires a human-centered approach to uncover the content, organization, and visualization methods to best support the information needs of practicing physicians.”
Association of Health Record Visualizations With Physicians’ Cognitive Load When Prioritizing Hospitalized Patients, JAMA Network Open 2020.1.15
2020.1.14
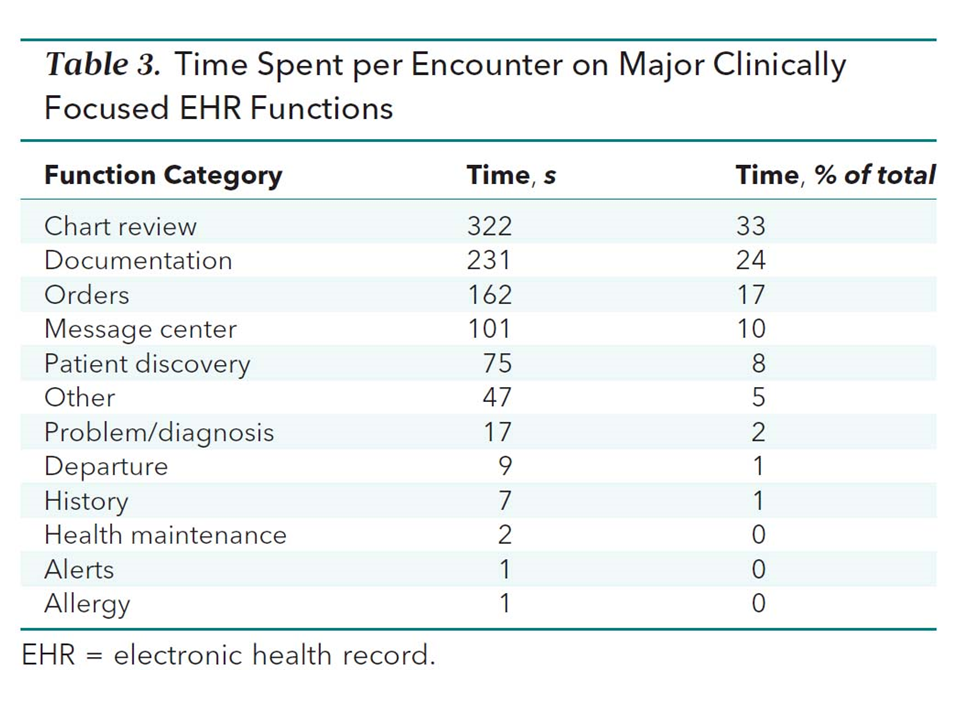
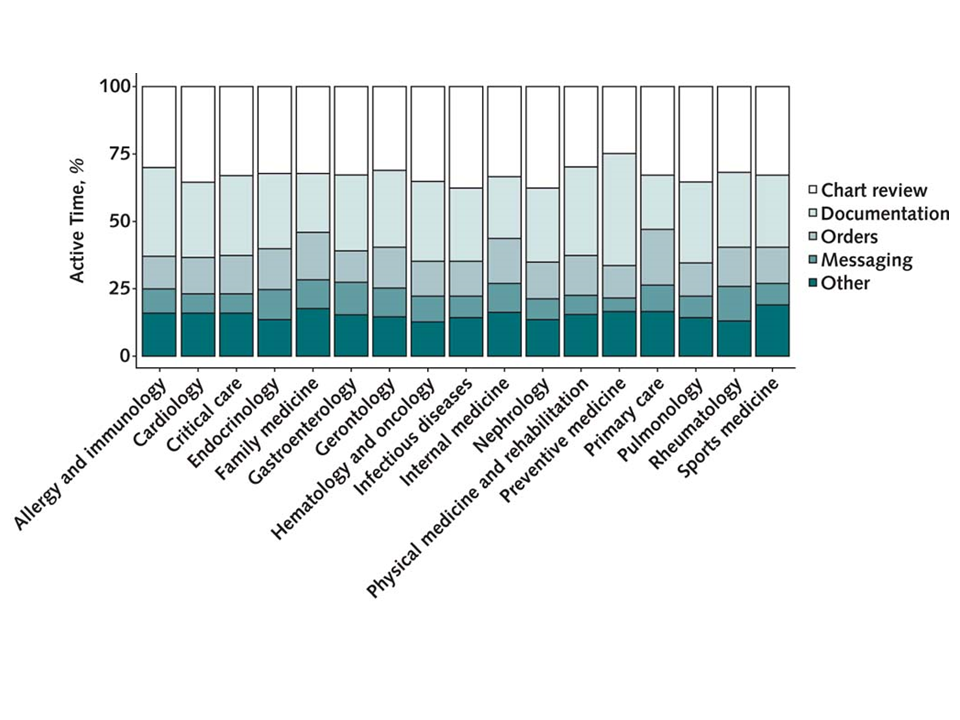
“How do we generate the foundation of clinical data needed to support the EHR’s many high-value uses (including but not limited to clinical care) while doing so efficiently (for example, improving user interface design, using digital scribes, and simplifying documentation)? Even with the most efficient approach, physicians (and many other types of clinicians) will never obtain a direct return from future use of their documentation equal to their time cost of documentation. At minimum, acknowledging this mismatch and making physicians feel valued for the time they spend in the EHR is needed.
[..] Chart review (33%), documentation (24%), and ordering (17%) combined accounted for almost 75% of EHR time. Although many shortcuts and tools have been developed for the latter 2 tasks (for example, note speed buttons and order sets), chart review stands out as the activity most in need of optimization but with the fewest tools available. Search bars are perhaps the most cutting-edge tool available at scale, and these do little to help physicians synthesize the troves of information in patient charts. Although investments in visualization tools and predictive models or artificial intelligence–enabled tools aim to help identify critical problems that could otherwise be missed, few target the outpatient setting and address common pain points like information synthesis.”
Electronic Health Record Time Among Outpatient Physicians: Reflections on the Who, What, and Why, Annals of Internal Medicine, 2020.1.14
2020.1.12
“anonymous “digital self-harm”, as researchers call it, is increasingly common. A study in 2019 found that nearly 9% of American adolescents have done it, up from around 6% in a previous study from 2016, according to an author of both studies, Sameer Hinduja, director of the Cyberbullying Research Centre and professor of criminology at Florida Atlantic University.
[..] Ana, a 20-year-old from Alabama, says she wanted to see if someone would stick up for her. At 14, she anonymously posted insults about her appearance to Ask.fm, a public question-and-answer site. Then she waited for other people to defend her. Her motivations, to express self-loathing and to get a reaction, are some of the most common among children who abuse themselves online.
About a third say digital self-harm achieved what they had hoped for. Riel, a university student in Georgia, says it was a useful way to counter other online abuse.
[..] Elizabeth Englander, director of the Massachusetts Aggression Reduction Centre, presumes there could be a deeper reason. Boys may have “fewer legitimate ways to get attention and sympathy”, she says. Whatever the profile of children who insult themselves online, doing so “betrays mental-health and well-being issues”, warns Mr Hinduja. Depression and drug use are also predictors. And like physical self-harm, the online version is linked to suicidal thoughts, though it is not yet clear which comes first.
[..] The worst response, according to Ms Englander, would be to dismiss evidence of bullying because it might be faked. “Any time a kid claims they’re being bullied, they’re struggling with something,” she says. For many, the source of that something is not an external tormentor, but one within.”
The Bully in the Black Mirror, Economist, 2020.1.11
2020.1.11
“[Introduction] Robotic surgery continues to diffuse across an increasingly broad range of surgical procedures. [..] In their [the FDA] communication, they expressed concerns about the lack of epidemiologic data characterizing the use of robotic surgery in real-world practice settings. Current estimates are limited to single-center studies, device manufacturers’ financial statements, and claims data, which may be inaccurate owing to unreliable coding. We used population-based data from a manually abstracted statewide clinical registry [Michigan Surgical Quality Collaborative, an AHRQ-recognized patient safety organization including over 90% of all surgical procedures in the state] to characterize contemporary trends in the adoption of robotic surgery across a range of general surgical procedures, which now represent the largest market for the technology in the United States.
[Results] From January 2012 through June 2018, the use of robotic surgery for all general surgery procedures increased from 1.8% to 15.1% (8.4-fold change; slope, 2.1% per year; 95% CI, 1.9%-2.3%). During the same period, the use of both laparoscopic and open surgery declined. [..] Trends in robotic surgery use were similar for specific procedures, although for some, the magnitude of the increase was greater. For example, the use of robotic surgery for inguinal hernia repair increased from 0.7% to 28.8% from January 2012 through June 2018 (41.1-fold change; slope, 5.4% per year; 95% CI, 5.1%-5.7%).
[Discussion] Within this context, regulators from the FDA recently expressed safety concerns about the rapidly growing use of robotic approaches for certain cancer operations. These concerns stem from the limited evidence of benefit (eg, fewer complications or better oncologic resection quality) for robotic surgery. For example, randomized clinical trials have failed to demonstrate the benefits of robotic surgery over other approaches in the treatment of rectal cancer and have shown even potentially worse outcomes in procedures for cervical cancer. Observational studies that compared robotic surgery with more established laparoscopic or open approaches have also failed to demonstrate superior outcomes after inguinal hernia repair, kidney resections, colectomy, or cholecystectomy. The discrepancy between the ongoing rapid adoption of robotic surgery and unclear clinical benefit highlights why accurate information on how it is being applied in contemporary surgical practice is necessary.
[..] For many common and low-risk procedures, such as cholecystectomy, conventional laparoscopic surgery is already the accepted standard of care. Laparoscopic approaches are also less expensive and can be performed by most general surgeons without robotics. This situation highlights a questionable trend: robotic surgery is replacing conventional laparoscopic approaches for procedures that may not be complex enough to warrant the consideration of an advanced, expensive, and unproven minimally invasive platform.
[..] This study suggests that regulators and the surgical community can take additional steps to monitor the ongoing diffusion of robotic surgery and ensure that this trend does not lead to diminished patient safety. Because accurate data are necessary to inform the creation of appropriate safeguards, the FDA and the Centers for Medicare & Medicaid Services should consider providing coverage for robotic surgery with provisions for evidence development. This process has been previously used by the Centers for Medicare & Medicaid Services to create registries of patients treated with new and unproven surgical technologies (eg, carotid artery stenting). Use of these provisions would facilitate greater understanding of how robotic procedures are being used in real-world practice. Akin to postmarket surveillance of pharmaceuticals, such provisions would also create a common data resource from which the comparative safety and effectiveness of robotic operations can be evaluated by numerous investigators.
[..] At present, surgeons are largely able to use robotic surgery for any procedure at their professional discretion. As has been shown in the FDA warning and through prior studies, this discretionary use may place patients at risk for poor outcomes. Facilitating transparency around the allocation of robotic surgery would allow patients to make better collaborative decisions with their surgeons. After all, for many of the procedures we report in this study, little to no evidence suggests that robotic surgery increases patient safety or treatment effectiveness compared with other approaches.”
Trends in the Adoption of Robotic Surgery for Common Surgical Procedures, JAMA Network Open, 2020.1.10
“As with doctors who become key opinion leaders, patients who engage with drug companies are doubtless chosen because they offer industry-friendly opinions. But if they never say something they didn’t believe, what’s the problem? One problem is that corporate support gives patients with industry-friendly views more visibility, allowing them to drown out opposing views. Another is that industry-aligned positions shared by patient leaders may be misleading and not based on evidence. A third problem is that for patient leaders, who have built their trusted communities without any outside resources, revenue from — and warm relationships with — industry may in fact influence what they believe, because the relationship reinforces industry-friendly opinions, creates the illusion of partnership, and lessens the chances that patients will adopt industry-critical stances.
[..] There is no reason for media, legislators and policymakers to be suspicious of patients – when they have no acknowledged ties to industry. Professional patients – and the companies that pay them – do not have to disclose payments. Industry does have to disclose payments to physicians, which enabled researchers to determine that financial ties with industry change physicians’ prescribing behavior.”
Patient Influencers Paid By Pharmaceutical Companies Should Be Required To Disclose Industry Ties, Health Affairs blog, 2020.1.10
2020.1.10
“[Kaiser Permanente] The hospital and health-insurance company, based in Oakland, Calif., said the rehab program, in which patients participate remotely, is showing promising results. Kaiser is betting on remote monitoring via wearables to cut costs in areas such as hospital readmissions.
More than 2,300 patients recovering from a cardiac event enrolled in the remote eight-week rehab program between June 2018 and June 2019, according to a paper published in NEJM Catalyst. More than 87% of the patients completed it, compared with less than 50% on average for Kaiser’s in-clinic rehab programs, the company said.
Readmission rates based on cardiac-related conditions in the remote program were less than 2% through June 2019, compared with 10% to 15% on average for in-clinic programs. The program, which started in Southern California, has continued since June 2019 and is expanding to more states.
The patients have been wearing Samsung Electronics Co. smartwatches supplied by Kaiser for the duration of the program.
Users receive reminders on the smartwatch to do things such as work out or take medication. A mobile app accessible through the smartwatch includes a questionnaire where patients provide details including the type and duration of exercise and whether they experienced any symptoms. The watch collects additional data such as steps and pulse.
The program supplied around 4,000 Samsung smartwatches to patients by the end of 2019. In 2020, the company expects to add about 5,000 patients who suffered cardiac events, which include heart attacks, bypass surgery and heart failure.
[..] In Kaiser’s virtual-rehab program, data collected by wearable sensors play a supporting role to the app the patients use. Kaiser and Samsung worked together to customize a version of Samsung’s HeartWise app to remind patients of program goals and deliver their responses to physicians.
The program includes exercise regimens, counseling and other steps to improve a patient’s health and lifestyle.
“This one is not continuous monitoring. But it’s almost as though somebody’s calling you every day, all the time, to see what’s going on,” said Tad Funahashi, Kaiser’s chief innovation and transformation officer for Southern California, who led the program’s development.
If a patient isn’t meeting obligations, such as failing to exercise for a specific amount of time, health-care providers can follow up with phone calls or during in-clinic sessions. The alerts are triggered by information provided by the user. Data including step counts and heart rate to check exertion are available to doctors or nurses through a dashboard on Kaiser’s system so they can review and adjust the rehabilitation program.”
Kaiser Permanente Bets on Smartwatches to Lower Costs, Wall Street Journal, 2020.1.9
“California would become the first state to sell its own brand of generic prescription drugs in an effort to drive down rising healthcare costs under a proposal Gov. Gavin Newsom is expected to unveil in his new state budget Friday.
A broad overview of the ambitious but still conceptual plan provided by Newsom’s office says the state could contract with one or more generic drugmakers to manufacture certain prescriptions under the state’s own label. Those drugs would be available to all Californians for purchase, presumably at a lower cost. The governor’s office said the proposal would increase competition in the generic drug market, which in turn would lower prices for everyone.
[..] “Every state has been frustrated with high drug prices,” said Trish Riley, executive director of the National Academy for State Health Policy. “They want to balance their budgets and these drug price spikes make it difficult. This could have tremendous impact.”
No other state has attempted to cut out the supply chain that leads to drug markups, Riley said, but there is another, smaller-scale model California can turn to.
More than 1,000 hospitals in 46 states are a part of a nonprofit company called Civica Rx, which formed in 2018 to manufacture generic injectable drugs used in hospitals to lower costs and create a stable supply of the medicines. The nonprofit delivered its first generic drug to hospitals in the fall, an antibiotic that had been in short supply.
[..] Health experts said California’s plan has the potential to assist consumers if done correctly but cautioned that the state should not expect it to yield significant savings. Those experts said the state could identify drugs that have not generated sufficient competition among generic drug manufacturers and try to compete, but that would mean producing medicines that are in less demand.
It is unlikely that would lead to large savings for the state, but it could drive down prices on some less commonly used drugs for a smaller number of Californians, said USC health economist Geoffrey Joyce.
“This is not a bad move,” Joyce said. “But I wouldn’t oversell it. It will make a modest dent in overall drug spending and drug pricing in California. You are benefiting a modest group of patients, but you are benefiting them in a significant way.”
California eyes selling its own brand of generic prescription drugs to battle high costs, Los Angeles Times, 2020.1.9
“America suffers from a severe shortage of primary care. Right now, 78 million U.S. residents live in Health Professional Shortage Areas (HPSAs), which the federal government defines as having more than 3,500 patients for each primary-care provider. Sixty percent of these areas are rural.
The problem grows worse each day. Currently, the United States is short about 14,000 primary-care physicians. But that figure could grow to more than 49,000 by 2030, according to a report by Peter Buerhaus, Ph.D., published by the American Enterprise Institute.
Nurse practitioners and other practitioners are well-positioned to solve this crisis — and in some areas, already are. NPs complete both undergraduate and graduate-level academic and clinical training, including a master’s or doctoral degree, pass national certification exams and receive board certification, and meet state license requirements to practice. This training prepares them to evaluate and diagnose patients, order and interpret diagnostic tests, and prescribe medications in all 50 states. Importantly, more than 85% of NPs are trained in primary care — including pediatric, geriatric, and women’s health.
They provide outstanding care to patients. Study after study finds that NPs achieve patient outcomes equivalent to physicians, according to the National Academy of Medicine. And, patient satisfaction with NPs consistently ranks high.
Nurse practitioners already shoulder much of the primary-care burden in America. Last year, the ranks of NPs grew to a record 270,000, and they conduct more than one billion patient visits annually. Between now and 2030, the NP workforce is projected to grow by 6.8% annually, according to Buerhaus. By comparison, the physician workforce is expected to grow just 1.1% annually.
Unfortunately, just 21 states and the District of Columbia license NPs to the top of their education that allows them to provide primary-care services without unnecessary physician oversight. The rest impose unnecessary restrictions.
For instance, in 28 states, it’s illegal for NPs to practice without a “permission slip” in the form of “collaborative agreements” with physicians. These agreements needlessly impede patients’ access to high-quality NP care and increase health-care costs. Many states, most notably Missouri, even prevent NPs from practicing more than a few miles from their collaborating physician.
[..] In November 2018, the U.S. Department of Health and Human Services released a report — in conjunction with the Treasury and Labor Departments — that called on states to update their scope of practice laws. The National Academy of Medicine has recommended similar reforms. In October 2019, the administration also released an executive order that would lift barriers to NP practice in the Medicare program.
Politicians up and down the ballot have the power to help their constituents by supporting such commonsense, bipartisan reforms. Eight of the top 10 healthiest states in the United States have granted full practice authority for NPs, according to a UnitedHealth Foundation report. Meanwhile, the bottom 10 states all restrict NP practice.”
Expanding the role of nurse practitioners should be low-hanging fruit for health-care reform | Opinion, Philadelphia Inquirer, 2020.1.9
“In Dying of Whiteness, Jonathan Metzl attempts to trace these connections by probing how the armed defence of whiteness harms and sometimes kills white people too. Situating his analysis within the political landscapes of Missouri, Tennessee, and Kansas, Metzl explores how white Americans arm themselves with guns or votes, and attempt to individually secure the benefits of whiteness, shaping in the process the population health outcomes of everyone living in the wake of their political decisions—including other white people. From expansive gun legislation to broad divestment in government programmes, Metzl characterises white liberties that endanger white lives or imperil white futures as “dying of whiteness”.
[..] foregrounding “resentment” as the source of self-destructive white political behaviours has consequences. First, it erases white agency through emotional euphemism. Second, it minimises how white racism, especially when enacted through political choices, can simultaneously be self-interested and self-destructive. At times, Metzl artfully articulates and historicises the racist origins of white interest in firearm fanaticism and “small government” politics. At others, he turns to “racial anxieties”, racially charged “fears”, or “racial resentment” to describe white people’s political investment in white racial dominance. The effect is white choices to advance structural racism, and the violence those choices engender at a population level, get misinterpreted as primarily emotionally driven or disconnected from material reward.
This tendency, to mis-attribute white self-destruction and violence to psychological states or to obscure the impacts of defending whiteness through emotional euphemisms, is a common practice. For example, the disaggregated drivers of all-cause white mortality (conditions such as suicide, chronic liver disease, and drug and alcohol poisoning) have been described as “diseases of despair” rather than diseases of disproportionate opportunity (to wield firearms) and access (to prescription opiates). Media responses to white perpetrators of mass shootings have cited abstract “mental illness”, labelled shooters as “lone wolves”, and treated their violence as idiosyncratic rather than the deadly confluence of white racial terrorism, patriarchy, and liberalised access to guns. Even research examining the relation between whiteness and health suggests psychological “distress” contributes to how whiteness impairs health. And increasingly, intellectuals rapt with the concept of “white fragility” focus on the emotional discomfort white people experience when confronted with their racism, rather than the legacy of death in whiteness’s wake. To assert that resentment, despair, or any emotion that arises from being “left behind” accounts for white Americans’ self-destructive actions, violent politics, or declining population health misses two counterpoints.
First, if any population has been left behind in America’s colonial-turned-industrial-turned-technocratic political economy, it is Black (and Indigenous) people. Yet despite suffering at every turn of every decade of every century in this nation, generations of Black Americans have sought political reforms that expand electoral participation, increase government protections, and extend public resources beyond their individual or group benefit. And while Black Americans’ mortality rate exceeds that of their white peers (similarly driven in part by fatal drug overdoses and suicides), their deaths are a direct result of a political economy predicated on their individual and collective subjugation, not their individual or collective sadness.
Second, death and despair are not necessarily associated with economic downturns. Some recessions have bolstered investments in government supports that safeguard population health. For example, during the Great Depression mortality rates generally decreased and life expectancy increased, for whites and non-whites across gender. This was partly due to New Deal politics that forged the greatest advances in social benefits the USA has ever known—from social security and home loan assistance to the administrative precursors to welfare.
[..] despair and resentment are not the major drivers of increased mortality across racial groups in the USA, access to rights and resources is. Yet scholars, the media, and the public seem intent on viewing white voter patterns post-2016 and rising white deaths post-2010 as born of recessions, resentment, and racial divides. This myopathy overlooks the evolving ways white Americans continue to mobilise to maintain or extend the exclusive advantages whiteness offers those who can become white, even as those advantages place them in increasing proximity to death.
[..] it is not that amid the armed defence of whiteness some people have inadvertently or indirectly died. Rather, death is the inevitable consequence of the full realisation of structural racism and the exclusive rights and resources it offers those who can become white. This type of death is perhaps more easily recognised when it is sudden and violent—like the deaths of Addie Mae, Cynthia, Carole, Carol Denise, Johnny, and Virgil. But it can also be “slow and [nearly] invisible”, as it is among white Americans who will deteriorate from chronic liver disease or substance use.
Ultimately, white racial terror can strike by blunt force or decaying infrastructure, through frank abuse or frank neglect. It can kill babies or mothers, immigrants or Indigenous peoples. But within a white racial ordering of humans, rights and resources, non-white and/or Black deaths become naturalised and expected. And white deaths appear to be the aberration. But they evidence the rule, not the exception.
For humans to use whiteness to manufacture access and privilege, they must engineer scarcity and loss. This entanglement between access and scarcity, privilege and loss, means white people’s unearned advantages have always been tethered to a legacy of untold deaths. This is not the result of an emotional positioning, but a structural one.”
Despair doesn’t kill, defending whiteness does, Lancet, 2020.1.11
“The starting point of even unwitting collusion stems from the unquestioning acceptance of the terms of debate set by academics, policy makers, and health authorities. Whenever we call for care for poorer inhabitants of poor communities to be restricted to what is cost-effective, where the effectiveness metric is set at mortality or the relatively abstract notion of a disability-adjusted life-year, interventions for conditions as complex, distressing and enduring as schizophrenia, dementia, or autism are weighted against those for malaria in terms of “best buys” and “value for money”. Such a narrow framing of human suffering is an immoral rationale for the discouragement or outright denial of care for people with conditions whose interventions are deemed not to be cost-effective.
[..] In the case of the WHO guidelines, for example, evaluations of clinical interventions and aggregated data of groups of patients randomised in trials trump the lived experience of mental health problems. Not surprisingly, although we know that quality care of severe mental disorders relies on a person-centred mix of medications and a range of psychosocial interventions enshrined in a rights-based framework of dignity and freedom, only the former comes close to any acceptable threshold of cost-effectiveness and, even then, only if the oldest and cheapest medicines are being used. Here, we encounter yet another canard, wherein cost is conflated with price, even though prices for commodities vary widely, as we have seen so dramatically with antiretroviral medications.
When viewed through this narrow prism, psychosocial and rights-based interventions are typically devalued. Given what we now know about the lethal consequences of coercion, social isolation, and exclusion and the positive impacts on life expectancy of freedom, social networks, dignified work, and decent housing, why do we not consider these as targets for interventions, on a par with improving cardiometabolic health, when they are all too common accompaniments to the lived experience of severe mental disorders and probably contribute to a considerable share of premature mortality? Will we have to wait for someone to run a randomised controlled trial with an economic evaluation to support the intervention of befriending, supported decision making, inclusion in the work-place, or decent housing before we acknowledge these as being worthy investments for health-care systems?
Moral arguments continue to be dismissed or undervalued in priority setting in global health. Instead, questions such as the burden of disease and cost-effectiveness that are predicated on the uncontested assumption that resources are constrained for strategies intended to achieve equity—but not for those intended to create more wealth for the already wealthy or to wage war—or that the primary locus of interventions for health-care problems is narrowly defined technological fixes, from bednets and vaccines to clinical treatments, dominate conversations on what decision makers should prioritise for resourcing. In the end, this approach pits those championing one disease against those championing another, each side trying to highlight the numbers of those affected or the proportion of the burden attributed to that condition, or the economic consequences of the condition, or the “value for money” to invest in interventions for that condition. Although the calls for a massive increase in investment in universal health coverage are a welcome step to realising the aspiration of quality care for all people and for all health conditions, they are still voices in the wilderness when compared with the economic arguments that continue to claim that the world cannot afford such care. These arguments fail to challenge the status quo fuelled by the increasing commercialisation and medicalisation of all aspects of health care, which is driving up costs. Moreover, this economic case neglects the already small and steadily shrinking budgets for the social sector, fuelled by policies that are propelling further widening of disparities and the failure to scale up low-cost, high-quality delivery strategies such as community health workers and to integrate social care interventions with health-care delivery.
We will need to reframe the appalling fact that most people with severe mental disorders and disabilities die earlier than they should simply because they do not have access to quality and person-centred care as a moral outrage, no less an insult to our basic humanity than the arguments that people with HIV in Africa could be left to die because their countries’ health systems were weak or the interventions unaffordable. To do so, global health delivery practitioners will need to adopt a rights-based approach to health care. This approach demands that people with the lived experience must be at the centre of decision making about which interventions should be prioritised. Interventions should cover both clinical and social aspects of the condition and they must be delivered with the full participation of the person affected, and those interventions that have a strong association with improved health and social outcomes must be resourced to reach the last mile. In line with this approach, we need to reframe the conversations on the neglect of mental health beyond advocating for scaling up evidence-based interventions and concurrently emphasise the right to quality care, free from any form of coercion that is fundamentally incompatible with rights-based care, and the need to address the social determinants that accompany mental health problems.
People with severe mental disorders and disabilities were subjected to horrific forms of torture and violence under the guise of mental health care for centuries and were among the first victims of the Nazi gas chambers. In our times, these individuals have been cast aside to sleep on the streets of cities of unimaginable wealth, or to be incarcerated in prisons, or kept in captivity in colonial-era asylums and religious healing shrines. Our collective failure to respond to the needs of one of the most vulnerable groups of people in society is a catastrophic failure of humanity. It is this humanity to which we must appeal to address this global injustice. The aspiration of universal health coverage cannot be met solely through considerations of what constitutes good value for money, but what is good value for humanity.”
The moral case for global mental health delivery, Lancet, 2020.1.11
“Do negative feelings in general trigger addictive behavior, or do specific emotions play a stronger role? Testing these alternative accounts of emotion and decision making, we drew on the Appraisal Tendency Framework to predict that sadness, specifically, rather than negative mood, generally, would 1) increase craving, impatience, and actual addictive substance use and 2) do so through mechanisms selectively heightened by sadness. Using a nationally representative, longitudinal survey, study 1 (n = 10,685) revealed that sadness, but not other negative emotions (i.e., fear, anger, shame), reliably predicted current smoking as well as relapsing 20 years later. Study 2 (n = 425) used an experimental design, and found further support for emotion specificity: Sadness, but not disgust, increased self-reported craving relative to a neutral state. Studies 3 and 4 (n = 918) introduced choice behavior as outcome variables, revealing that sadness causally increased impatience for cigarette puffs. Moreover, study 4 revealed that the effect of sadness on impatience was more fully explained by concomitant appraisals of self-focus, which are specific to sadness, than by concomitant appraisals of negative valence, which are general to all negative emotions. Importantly, study 4 also examined the topography of actual smoking behavior, finding that experimentally induced sadness (as compared to neutral emotion) causally increased the volume and duration of cigarette puffs inhaled. Together, the present studies provide support for a more nuanced model regarding the effects of emotion on tobacco use, in particular, as well as on addictive behavior, in general.”
Sadness, but not all negative emotions, heightens addictive substance use, PNAS, 2019.12.30
“Diabetes self-management education and support (DSMES) services facilitate the knowledge, decision-making, and skills mastery necessary for optimal diabetes self-care and incorporate the needs, goals, and life experiences of the person with diabetes.
[..] Emerging evidence demonstrates the benefit of internet-based DSMES services for diabetes prevention and the management of type 2 diabetes (36–38). Technology-enabled diabetes self-management solutions improve A1C most effectively when there is two-way communication between the patient and the health care team, individualized feedback, use of patient-generated health data, and education. Current research supports nurses, dietitians, and pharmacists as providers of DSMES who may also tailor curriculum to the person’s needs. Members of the DSMES team should have specialized clinical knowledge in diabetes and behavior change principles. Certification as a diabetes educator (see www.ncbde.org) and/or board certification in advanced diabetes management (see www.diabeteseducator.org/education/certification/bc_adm) demonstrates an individual’s specialized training in and understanding of diabetes management and support. Additionally, there is growing evidence for the role of community health workers, as well as peer and lay leaders, in providing ongoing support.
[..] DSMES is associated with an increased use of primary care and preventive services and less frequent use of acute care and inpatient hospital services. Patients who participate in DSMES are more likely to follow best practice treatment recommendations, particularly among the Medicare population, and have lower Medicare and insurance claim costs. Despite these benefits, reports indicate that only 5–7% of individuals eligible for DSMES through Medicare or a private insurance plan actually receive it. This low participation may be due to lack of referral or other identified barriers such as logistical issues (accessibility, timing, costs) and the lack of a perceived benefit. Thus, in addition to educating referring providers about the benefits of DSMES and the critical times to refer, alternative and innovative models of DSMES delivery need to be explored and evaluated.”
Facilitating Behavior Change and Well-being to Improve Health Outcomes: Standards of Medical Care in Diabetes—2020, Diabetes Care, 2019.12.19
“The U.S. Food and Drug Administration today [2019.12.13] authorized marketing of the Tandem Diabetes Care Control-IQ Technology, an interoperable automated glycemic controller device that automatically adjusts insulin delivery to a person with diabetes by connecting to an alternate controller-enabled insulin pump (ACE pump) and integrated continuous glucose monitor (iCGM). This is the first such controller that can be used with other diabetes devices that are also designed to be integrated into a customizable diabetes management system for automated insulin delivery. This FDA authorization paves the way for iCGMs and ACE pumps to be used with an interoperable automated glycemic controller as a complete automated insulin dosing (AID) system. AID systems typically consist of a pump, CGM and software to control the system of compatible devices.”
FDA authorizes first interoperable, automated insulin dosing controller designed to allow more choices for patients looking to customize their individual diabetes management device system, FDA press release, 2019.12.13
“[Results] Among 12 092 patients enrolled in the ACCELERATE trial, 8236 had DM, of which 8145 had a baseline HbA1c analyzed. [..] Statistically significant trends for age, sex, body mass index, current smoking, and presence of peripheral artery disease and congestive heart failure were noted with increasing levels of baseline HbA1c. Baseline LDL‐C, triglycerides, apolipoprotein B, and high‐sensitivity CRP (C‐reactive protein) were significantly greater, whereas high‐density lipoprotein cholesterol and apolipoprotein A1 were significantly less, with increasing baseline HbA1c. Patients with increasing baseline HbA1c were significantly more likely to be treated with a high‐intensity statin and antiglycemic medications, particularly sulfonylureas and insulin.
[..] Increasing baseline HbA1c levels were strongly associated with the occurrence of the primary composite end point (KM estimate, 12.6–18.2; P<0.001). Increasing baseline HbA1c levels were also associated with the triple end point of cardiovascular death, nonfatal MI, and stroke (KM estimate, 7.8–11.3) as well as the individual end points of nonfatal MI (KM estimate, 3.1–7.0), hospitalization for unstable angina (KM estimate, 1.8–5.0), and need for coronary revascularization (KM estimate, 7.3–11.1), although not for nonfatal stroke (KM estimate, 1.4–2.4). The observed rates of cardiovascular mortality (KM estimate, 2.6–4.3) and all‐cause mortality (KM estimate, 4.8–5.9) were similar regardless of baseline HbA1c levels. The competing risk of death did not alter conclusions on the individual end points of nonfatal MI, stroke, coronary revascularization, or hospitalization for unstable angina. When adjusting for significant baseline characteristics in a multivariable model, baseline HbA1c was an independent predictor for the primary composite end point censored at 915 days (hazard ratio, 1.06; 95% CI, 1.02–1.11).
[Discussion] The current analysis from a rigorously performed randomized clinical trial identifies glycemic control, as measured by HbA1c levels, in patients with DM at high cardiovascular risk to remain an independent predictor for the future development of cardiovascular events in contemporary clinical practice, despite statin use and near optimal LDL‐C levels at baseline. Moreover, our results suggest that although improved glycemic control may have diminishing returns in reduction of hard clinical end points, such as mortality and nonfatal stroke, among those with HbA1c <8.0%, as demonstrated in the ACCORD (Action to Control Cardiovascular Risk in Diabetes) and ADVANCE (Action in Diabetes and Vascular Disease: Preterax and Diamicron Modified Release Controlled Evaluation) trials, it remains strongly predictive of softer but clinically important end points, such as coronary revascularization and hospitalization for unstable angina.
[..] Given the post hoc nature of the analysis, it is vulnerable to confounding arising from both unmeasured and unaccounted variables. Some important variables, like duration of DM and changes in glycemic control over time, were not captured in our data set. Although the association between HbA1c and the primary composite end point appeared qualitatively linear across all groups and remained significant after multivariable adjustment, the relationship between HbA1c and the triple end point was likely driven by nonfatal MI, with no association noted between HbA1c and cardiovascular death or stroke. However, in the context of a chronic disease, like DM, the overall duration of follow‐up was relatively small and it may be reasonable to expect that the relationship between HbA1c and adverse cardiovascular outcomes would accentuate over time and among those with HbA1c >8.0%. [..] In clinical trials, exposure to evacetrapib as well as other CETP inhibitors has been shown to improve glycemic profile. No overall benefits or harm with evacetrapib was noted in the ACCELERATE trial, leading to our decision to evaluate the entire population with DM regardless of treatment assignment. In a sensitivity analysis restricted to the control arm, the association between increasing HbA1c levels and adverse cardiovascular outcomes persisted. Last, data on the use of novel antiglycemic agents, particularly those that influence cardiovascular outcomes, were not obtained.”
Impact of Baseline Glycemic Control on Residual Cardiovascular Risk in Patients With Diabetes Mellitus and High‐Risk Vascular Disease Treated With Statin Therapy, Journal of the American Heart Association, 2019.12.19
2020.1.9
“In 2014, the Pew Research Center asked Americans to rank the “greatest dangers in the world.” A plurality put inequality first, ahead of “religious and ethnic hatred,” nuclear weapons, and environmental degradation. And yet people don’t agree about what, exactly, “equality” means.
[..] The complexities of egalitarianism are especially frustrating because inequalities are so easy to grasp. C.E.O.s, on average, make almost three hundred times what their employees make; billionaire donors shape our politics; automation favors owners over workers; urban economies grow while rural areas stagnate; the best health care goes to the richest. Across the political spectrum, we grieve the loss of what Alexis de Tocqueville called the “general equality of conditions,” which, with the grievous exception of slavery, once shaped American society. It’s not just about money. Tocqueville, writing in 1835, noted that our “ordinary practices of life” were egalitarian, too: we behaved as if there weren’t many differences among us. Today, there are “premiere” lines for popcorn at the movies and five tiers of Uber; we still struggle to address obvious inequalities of all kinds based on race, gender, sexual orientation, and other aspects of identity. Inequality is everywhere, and unignorable. We’ve diagnosed the disease. Why can’t we agree on a cure?
[..] In [New York University’s School of Law Jeremy] Waldron’s view, though, it’s not a binary choice; it’s possible to see people as equal and unequal simultaneously. A society can sort its members into various categories—lawful and criminal, brilliant and not—while also allowing some principle of basic equality to circumscribe its judgments and, in some contexts, override them. Egalitarians like Dworkin and Waldron call this principle “deep equality.” It’s because of deep equality that even those people who acquire additional, justified worth through their actions—heroes, senators, pop stars—can still be considered fundamentally no better than anyone else. By the same token, Waldron says, deep equality insures that even the most heinous murderer can be seen as a member of the human race, “with all the worth and status that this implies.”
[..] The problem [“problem of expensive tastes,” what feels like a necessity to one person seems like a luxury to another] is familiar to anyone who’s argued with a foodie spouse or roommate about the grocery bill. It applies not just to material goods but to societal ones. To an environmentalist, protecting the spotted owl is a necessity; to a logger who stands to lose his job, it’s a luxury. The problem is so insistent that a whole body of political philosophy—“prioritarianism”—is devoted to the challenge of sorting people with needs from people with wants. It’s difficult in part because the line shifts as the years pass. Medical procedures that seem optional today become necessities tomorrow; educational attainments that were once unusual, such as college degrees, become increasingly indispensable with time. In a study for the National Bureau of Economic Research, four economists evaluated the success of President Lyndon Johnson’s War on Poverty. They found that, judging by a modernized version of the definition of “poverty” which Johnson used, the poverty rate in America fell from 19.5 per cent in 1963 to 2.3 per cent in 2017. Still, they note in their paper, “expectations for minimum living standards evolve.” Today, taking advantage of the social safety net that the War on Poverty put in place—food stamps, Medicaid, and so on—is itself a sign of poverty. A new, more robust safety net—free college, Medicare for All—becomes, for some, an egalitarian necessity.
[..] As Americans, we are charged with recognizing two conflicting values: individualism and egalitarianism. By smoothing out the unlucky differences while accepting those for which people are responsible, luck egalitarianism promises to help us be individualists and egalitarians simultaneously, But, as Anderson and others have argued, doing this is harder than it sounds. One problem, [philosopher Richard] Anderson writes, is that luck egalitarianism condescends to those it helps: by seeing them as hapless victims of circumstance, it denies them the “equal respect” they’re due as citizens of a democracy. (It’s perhaps for this reason that the people who might benefit from the extension of government programs so often vote against them.)
[..] [political theorist Yascha] Mounk thinks that most people understand, intuitively, that the distinction between structure and agency is—like the distinction between “nature” and “nurture”—an artifact of explanation, not a part of reality. All explanations are limited, we know, and tell only part of the story. This, he writes, is why we are so ambivalent about luck egalitarianism and the politicians who see the world through its lens. Conservatives, hoping to constrain the size of the welfare state, overstate how much control people have over their lives; liberals, hoping to expand it, overstate our powerlessness. But both positions are unconvincing. “While voters are receptive to the idea that it is deeply unjust for some public schools to have better funding than others, they balk when they are told that students who do well in school are merely lucky,” Mounk writes. “And while they recognize that the explanation for the stagnating living standards of average people lies in larger structural transformations of the world economy, they are skeptical when they are told that the choices of specific individuals don’t play any role in determining their particular economic fate.”
[..] [philosopher David] Schmidtz identifies four structures: equality, desert, reciprocity, and need. We consult these in different contexts, to solve different kinds of problems. Citizens are owed equality before the law. Workers, by contrast, should be compensated differently, depending on what they have accomplished. In relationships with our partners, we favor reciprocity. In trying to do right by our children, we ask what they need. [..] None of these principles are capacious enough to serve in every situation; in fact, they are often in tension with one another. And they can be used inappropriately. No one wants a merit-based marriage. A workplace that operates by reciprocity is a dysfunctional one.”
The Equality Conundrum, The New Yorker, 2020.1.6
“[Introduction] both practitioners and researchers have undertaken efforts to develop a wide collection of interventions targeting the growing population of at-risk children1. Traditionally, these interventions focused solely on nutritional aspects of a child’s life. However, recent literature has found the roots of obesity to be far more complex. This complexity is perhaps best captured in the 2010 work of Puder and Munsch, which notes, “Rather than a stable condition, childhood obesity represents a dynamic process, in which behavior, cognition and emotional regulation interact mutually with each other, with biological parameters, as well as with contextual factors, such as parental attitudes and familial eating, activity and nutritional patterns.
[..] Our study focused on children (aged 0–10) and their families who received treatment at the Centre for Nutritional Recovery and Education (CREN), a large non-for-profit NGO in São Paulo, Brazil. CREN represents a unique study center offering patients a two-year interdisciplinary treatment program. As part of the program, healthcare professionals identify and treat comorbidities associated with a child’s obesity, evaluate the child’s body composition through bio-impedance and follow life-style habits with daily records of activity, sleep and screen time, and nutritionists provide detailed counseling on a family’s diet. Additionally, CREN offers group sessions where physical activities and nutritional workshops are provided for children and their guardiansFootnote1. Finally, interwoven through each service is a registered psychologist who provides support to understand the elements underlying a child’s nutritional state.
[..] we derived a BMI thereshold for measuring improvement through an analysis of clinical tests; additional details about this measurement are included in the Methods section. Based on this BMI threshold, we divide the study population into two groups: Those with a significant improvement in BMI score (henceforth referred to as IMPV, n:128); and those who exhibited minimal or insignificant change (deemed MC, n:372).
[Results] We observe several psychological characteristics with a probability ≥90% of occurring at a higher prevalence within one of outcome populations. For the IMPV population, these included elements of loneliness, willingness to discuss interpersonal relationships during the interview, difficulty changing, and concern about their own health. While, the MC cohort exhibited increased occurrence probabilities for characteristics such as guardian elements of immaturity, aggressiveness, lack of authority, and child affective deprivation behavior (in which a child must act out to receive attention), shyness, and insecurity. It is important to note that because a psychological characteristic was observed to have a higher prevalence among the IMPV group, does not imply the characteristic is an inherently positive trait.
[..] These results present evidence to support the value of not only looking at psychological interactions within children or their guardians, but interactions between children and guardians as well. For example, at the baseline, children with shyness tend to occur at higher prevalence in the MC population, however when presented alongside highly mature guardians, guardians that are worried about/discuss the child’s behavior, or guardians who act in an overprotective manner, the outcome is more likely to be IMPV.
[Discussion] While the majority (59) of the 77 psychological characteristics were exhibited by children in both populations, a subset exhibited strong associations with one of the two nutritional outcomes. Such baseline associations offer a platform on which to study the novel associations between interactions of co-occurring psychological characteristics and the effectiveness of a nutritional intervention. Among the most prominent examples is child loneliness, which had a higher baseline probability of association with children in the IMPV population.”
Unraveling Complexity about Childhood Obesity and Nutritional Interventions: Modeling Interactions Among Psychological Factors, Scientific Reports, 2019.12.11
“The progress against cancer reflects large declines in mortality for the 4 major cancers (lung, breast, prostate, and colorectum). Specifically, as of 2017, the death rate has dropped from its peak for lung cancer by 51% among males (since 1990) and by 26% among females (since 2002); for female breast cancer by 40% (since 1989); for prostate cancer by 52% (since 1993); and for CRC [colorectal cancer] by 53% among males (since 1980) and by 57% among females (since 1969). The CRC death rate in women was declining prior to 1969, but that is the first year for which data exclusive of the small intestine are available. Two decades of steep (4% per year on average) declines for prostate cancer are attributed to an earlier stage at diagnosis through PSA testing, as well as advances in treatments. However, prostate cancer death rates stabilized in recent years, possibly related to declines in PSA testing and an uptick in the diagnosis of distant stage disease. Declines in mortality have also slowed for female breast and CRC. In contrast, declines in lung cancer mortality have accelerated, from approximately 3% annually during 2008 through 2013 to 5% during 2013 through 2017 in men and from 2% to almost 4% in women.
Recent mortality declines are even more rapid for melanoma of the skin, most likely reflecting improved survival in the wake of promising new treatments for metastatic disease. In 2011, the US Food and Drug Administration approved ipilimumab, the first immune checkpoint inhibitor approved for cancer therapy, and vemurafenib, a BRAF inhibitor, for the treatment of advanced melanoma. Subsequently, the 1‐year relative survival rate for metastatic melanoma escalated from 42% for patients diagnosed during 2008 through 2010 to 55% for those diagnosed during 2013 through 2015. Likewise, the overall melanoma mortality rate dropped by 7% annually during 2013 through 2017 in men and women aged 20 to 64 years compared with declines during 2006 through 2010 of approximately 1% annually among individuals aged 50 to 64 years and 2% to 3% among those aged 20 to 49 years. The impact was even more striking for individuals aged 65 years and older, among whom rates were increasing prior to 2013 but are now declining by 5% to 6% per year. We also examined melanoma mortality trends stratified by age and county‐level poverty because dissemination of newly approved therapies has been slower among the uninsured, who are more likely to be of lower socioeconomic status. Trends were similar in poor versus affluent counties among individuals aged 65 years and older, who are universally insured, as well as among women aged younger than 65 years. However, among men aged younger than 65 years residing in poor counties, there was no acceleration in the decline following drug approval. Our inability to detect a difference in the trend by poverty status among women may reflect their melanoma survival advantage over men and/or their higher prevalence of health insurance coverage.
[..] sex‐specific incidence is highest in non‐Hispanic black (NHB) men, among whom rates during 2012 through 2016 were 85% higher than those in Asian/Pacific Islander men, who have the lowest rates, and 8% higher than those in NHW [non-Hispanic white] men, who rank second. Among women, NHWs have the highest incidence, 8% higher than NHBs (who rank second); however, NHB women have the highest cancer mortality rates–13% higher than those for NHW women. The mortality disparity among men is likewise larger, with the death rate in NHB men double that in Asian/Pacific Islander men and 20% higher than that in NHW men. However, the black‐white disparity in overall cancer mortality among men and women combined has declined from a peak of 33% in 1993 (279.0 vs 210.5 per 100,000 population) to 13% in 2017 (178.5 vs 157.5 per 100,000 population). This progress is largely due to more rapid declines in deaths from smoking‐related cancers among blacks because of the steep drop in smoking prevalence unique to black teens from the late 1970s to early 1990s.”
Cancer statistics, 2020, CA: A Cancer Journal for Clinicians, 2020.1.8
“[Methods] The intervention targeted superutilizers of the health care system — persons with medically and socially complex needs who have frequent hospital admissions. The inclusion criteria were at least one hospital admission at any of four Camden-area hospital systems in the 6 months before the index admission, when patients were enrolled; at least two chronic conditions; and at least two of the following traits or conditions: use of at least five active outpatient medications, difficulty accessing services, lack of social support, a coexisting mental health condition, an active drug habit, and homelessness. Patients were excluded if they were uninsured, had cognitive impairment, or were receiving oncologic care or had been admitted for a surgical procedure for an acute health problem, for mental health care (with no coexisting physical health conditions), or for complications of a progressive chronic disease for which limited treatments were available. The eligible population composed less than 0.5% of the Camden population but accounted for 11% of the city’s hospital expenditures.
The time-limited intervention had intensive clinical and social components. Patients were enrolled while in the hospital. Once they returned home, patients worked with a multidisciplinary team that included registered nurses, social workers, licensed practical nurses, community health workers, and health coaches. The team conducted home visits, scheduled and accompanied patients to initial primary and specialty care visits, coordinated follow-up care and medication management, measured blood pressure and blood sugar levels, coached patients in disease-specific self-care, and helped patients apply for social services and appropriate behavioral health programs. The intervention contained many characteristics considered important for successful care-transition programs for high-cost, high-need patients.
[Results] Among patients in the treatment group, 95% had at least three encounters with program staff after enrollment; on average, a patient received 7.6 home visits and 8.8 telephone calls from staff and was accompanied on 2.5 physician visits, and 90% worked with the Coalition for more than 30 days. The median duration of program participation was 92 days.
[..] Receipt of government benefits during the 6 months after discharge was the one metric of program implementation observed in both the treatment and control groups. Rates of participation in both Temporary Assistance for Needy Families and General Assistance were low and did not significantly change with the intervention; the adjusted difference in participation in the Supplemental Nutrition Assistance Program associated with the intervention was 4.6 percentage points (95% confidence interval [CI], 0.5 to 8.6).
[..] The 180-day readmission rate was 62.3% in the treatment group and 61.7% in the control group. The intervention had no significant effect on this primary outcome: the adjusted difference in the probability of readmission was 0.82 percentage points higher in the treatment group than in the control group (95% CI, −5.97 to 7.61; P = 0.81). This finding is robust to the use of multiple imputation to account for missing data (adjusted difference, 0.64 percentage points; 95% CI, −6.12 to 7.40). The intervention also had no effect on any of the secondary outcomes or within any of the prespecified subgroups.
[..] estimates of the change in hospital admissions before and after the intervention that were based only on the intervention group were very sensitive to the definition of the period before the intervention. There was a 38-percentage-point decrease in the probability of a hospital admission during the 6 months after the intervention as compared with the 6 months preceding the intervention, but there was a 29-percentage-point increase in the probability of a hospital admission in the 6-month period after the intervention as compared with the 12-to-18-month period that preceded the intervention.
[Discussion] Engagement with the program was high (95% of patients had at least three encounters with program staff), and patients received an intensive intervention (averaging 7.6 home visits), but two program goals related to the timing of services — a home visit within 5 days after hospital discharge and a visit to a provider’s office within 7 days after discharge — were achieved less than 30% of the time. Challenges in reaching these goals included patients’ lack of stable housing or a telephone and their behavioral health complexities and providers’ few available appointments. The difficulties that this pioneering, data-driven organization had in achieving rapid assistance for patients may portend difficulties in achieving it at scale.
Our findings may also reflect fundamental challenges with the strategy of targeting superutilizers: many patients whose medical costs are high today will not be as high in the future — and this trend becomes even more pronounced as one goes higher in the cost distribution. Moreover, for patients with medical costs that are persistently high, few of those costs may be related to potentially preventable hospitalizations.”
Health Care Hotspotting — A Randomized, Controlled Trial, NEJM, 2020.1.9
2020.1.8
“The American Hospital Association’s newly released 2020 Hospital Statistics report shows the 6,146 hospitals in the U.S. delivered a cumulative 879.6 million outpatient visits in 2018, 0.9% less than in 2017, when they delivered 880.5 million outpatient visits. The data, which covers health system-owned ambulatory surgery centers, outpatient clinics and urgent care clinics, is the first year-over-year decline since 1983, and comes even as health systems work to expand their outpatient offerings beyond hospital campuses.
[..] The outpatient decline was specifically in the number of emergency outpatient visits hospitals delivered in 2018, said Aaron Wesolowski, the AHA’s vice president of policy research, analytics and strategy. Other areas of outpatient utilization were stable or up slightly over 2017, he said.
Patients who used to visit emergency departments are now going to urgent care clinics or other settings that may or may not be owned by health systems, Wesolowski said.
[..] Despite the lower number of visits, hospitals’ net outpatient revenue increased 4.5% year-over-year in 2018 on a cumulative basis, even as net inpatient revenue rose 2.1%.
As in prior years, the newest AHA data show the gap between outpatient and inpatient revenue continues to narrow. Hospitals’ net outpatient revenue—$494 billion—was 97% of net inpatient revenue—$508 billion—in 2018, compared with 95% in 2017 and 92% in 2016.”
U.S. hospitals see first decline in outpatient visits since 1983, Modern Healthcare, 2020.1.7
“While there is more than one path to healthcare affordability, core elements include:
- Enacting policies to ensure affordable coverage options for all:
- Medicaid expansion implemented by Dec. 31, 2019;
- Supplemental premium subsidies, reinsurance, Medicaid Buy-In, Basic Health Plan or other options for families that earn too much to qualify for Medicaid;
- Coverage options for recent or undocumented immigrants; and
- Eliminating the five-year wait and extending Medicaid and CHIP coverage to lawfully present immigrant children and pregnant women without qualified status;
- Providing prenatal care to women regardless of immigration status by extending CHIP coverage to the unborn child; and
- Using state funds to provide coverage options for undocumented immigrants.
- Strong rate review for fully insured, private market coverage options.
- Ensuring coverage options feature affordable cost-sharing and don’t leave consumers underinsured or create barriers to high-value
care:- Protecting consumers from inadvertent, surprise out-of-network medical bills;
- Extend protections to both emergency department and in-network hospital settings;
- Apply laws to all types of insurance, including both HMOs and PPOs;
- Protect consumers both by shielding them from harm resulting from extra provider charges—meaning they are not responsible for the charges—and prohibiting providers from balance billing; and
- Adopt an adequate payment standard—a rule to determine how much the insurer pays the provider—or a dispute-resolution process to resolve payment disputes between providers and insurers.
- Protecting consumers from skimpy, confusing short-term, limited-duration plans;
- Waiving or reducing cost-sharing for high-value services; and
- Deploying standard plan designs in the state-based Exchange.
- Protecting consumers from inadvertent, surprise out-of-network medical bills;
- Addressing the underlying causes of high healthcare costs by reducing spending on low value care and curbing excess prices:
- Whether the state requires validated reporting for four types of medical errors (healthcare-acquired conditions, healthcare-acquired infections, medication errors, and diagnostic errors);
- Whether the state refuses to pay for “never events,” serious reportable events (as identified by the National Quality Forum) that should never occur in a healthcare setting;
- Whether hospitals have adopted the CDC’s ‘Core Elements’ of antibiotic stewardship; and
- Whether states are measuring low value in claims data and/or electronic health records (EHRs)”
Altarum Healthcare Affordabililty State Policy Scorecard Summary Report, January 2020
2020.1.7
“[Introduction] In 1970, health spending as a share of gross domestic product (GDP) was virtually identical in the 2 nations: 6.2% in the United States and 6.4% in Canada. By 2017, U.S. costs, at 17.9% of GDP, far exceeded those in Canada (11.3%)—a difference largely attributable to higher prices for care in the United States.
Many features of Canada’s approach—for example, tighter control of drug prices, physicians’ fees, hospital budgets, and investments in high-tech facilities—underlie the price disparities. In addition, older research suggests that excess administrative costs incurred by U.S. hospitals, physicians, and other providers act as a hidden surcharge that inflates their prices and fees.
Recent studies indicate that U.S. physicians’ billing costs remain high, as does insurance overhead. However, no analyses since our 2003 study have compared administrative costs in a broad range of medical settings in the United States and other nations. Here, we present comprehensive 2017 estimates of such costs in the United States and Canada.
[Results] Insurers’ overhead in the United States in 2017 totaled $274.5 billion: $844 per capita, 9.6% of total expenditures by insurers and other third-party payers, or 7.9% of national health expenditures. The $274.5 billion in insurers’ overhead encompasses $45.0 billion in government expenditures to administer health programs and $229.5 billion in private insurers’ overhead and profits, an amount that includes private insurers’ overhead for administering self-insured plans for employers as well as managed-care plans funded by the public Medicare and Medicaid programs.
Canadian expenditures to administer health programs totaled $5.360 billion: $146 per capita, 3.8% of expenditures by insurers and other third-party payers, or 2.8% of national health expenditures. This includes $2.149 billion ($59 per capita) in federal and provincial government spending to administer health programs (1.6% of total government expenditures for such programs) and $3.210 billion for the overhead and profit of private insurers, who offer supplemental coverage; 12.7% of those insurers’ premium revenues.
[..] Overall, interacting with payers cost U.S. physician practices a mean of $169 302 annually per physician and accounted for 21.8% of gross receipts, equivalent to $151.2 billion nationally or $465 per capita. The comparable estimates for Canada were $36 825 per physicians, 10.78% of gross receipts, and $87 per capita.
In the sensitivity analysis, applying U.S. compensation rates to Canadian doctors and their office staff raised the Canadian estimate to $62 628 per physician, or $129 per capita.
The U.S.–Canada difference of $132 477 per doctor (or $106 675 at U.S. compensation rates) is equivalent to $118.354 billion nationwide ($95.268 billion at U.S. compensation rates). After adjustment for the small differences in physician supply in the 2 nations, the excess administrative spending in U.S. doctors’ offices represents $364 (or $293) per capita.
[..] Health care administrative costs in the United States in 2017 totaled $812.0 billion, $2497 per capita ($2696 per insured person), or 34.2% of total spending in the categories for which data are available. The comparable estimates for Canada are $551 per capita ($593, assuming U.S. wage rates in doctors’ offices), or 17.0% of expenditures. The difference amounts to over $1900 per capita (or over $2100 per insured person), equivalent to more than $600 billion in excess administrative spending in the United States.
In the United States, 531.2 persons per 10 000 population worked in health care delivery settings, including 129.7 per 10 000 population in administrative occupations. The comparable figures for Canada were 458.9 per 10 000 population overall, and 88.9 per 10 000 population in administration. The 40.8 per 10 000 population difference in administrative personnel accounted for 56% of the difference in the delivery system workforce, suggesting that administrative work accounts for a substantial share of differences in provider costs (and prices).
[Discussion] private insurers expanded their role as subcontractors administering Medicaid- and Medicare-managed care plans, pushing up overhead in those programs. States have shifted most Medicaid recipients into private managed care plans whose overhead is more than twice that of publicly administered Medicaid. Similarly, the overhead of private Medicare Advantage plans, which now cover about one third of Medicare enrollees, is 6-fold higher than that of traditional Medicare (12.3% versus 2.0%), a difference of about $1155 per enrollee ($1360 versus $205). Special studies using claims data and plans’ filings with regulators have found even higher overhead in Medicare Advantage—as much as $1608 per enrollee.
Private insurers’ overhead is also high in Canada and elsewhere: for example, 26.4% in the United Kingdom, 12.4% in Switzerland, 20.9% in Germany, and 17.8% in Sweden. But such insurers play a far larger role in the United States; among wealthy nations, total insurance overhead is proportional to the extent of private insurers’ involvement.
Interacting with multiple insurers with varying fee schedules, deductibles, prior-approval requirements, formularies and referral networks (and the flux of patients among insurers) also drives up U.S. physicians’ overhead costs, and hence the fees they must charge. In Canada, physicians send bills to a single insurer, all hospitals and physicians are “in-network,” one formulary applies to all patients, prior-authorization requirements are rare, and copayments and deductibles are proscribed.
Canada’s hospital payment system is also simple. Most hospitals are paid lump-sum “global” budgets to cover all operating costs, with separate grants for new capital investments. This payment strategy eliminates most billing and the need to attribute costs to individual patients. (The term “global budgets” has also been applied to Maryland’s hospital payment system. However, unlike Canadian hospitals, Maryland’s continue to bill on a per-patient basis—although total revenues are capped. Hospital administrative costs in Maryland are similar to those in other states [Himmelstein DU. Unpublished data]). The Canadian approach also minimizes incentives for upcoding, revenue-cycle management, and other financial exertions, which have intensified in the United States. These, along with the added administrative costs (about $200 per enrollee) associated with accountable care organizations, may explain the recent upswing in hospitals’ administrative costs. Whereas hospital administrative costs are lowest in Canada and Scotland, whose single-payer systems fund hospitals through global budgets, European nations with multiple, stringently regulated nonprofit insurers that pay uniform rates also have somewhat lower hospital administrative costs than the United States.”
Health Care Administrative Costs in the United States and Canada, 2017, Annals of Internal Medicine, 2020.1.7
“[Results] In 2017, Medicare Part D spent $22 billion on all DM therapies (144% increase from 2012). Medicare spent $94 billion on DM therapies from 2012 to 2017, including $60 billion on insulin ($55 billion on analog, $5 billion on human). Medicare filled 36% more analog insulins prescriptions but 17% fewer human insulin prescriptions over this timeframe. Since 2015, spending increases for analog insulin have slowed, driven by plateauing in per-claim spending for long-acting insulins.
Noninsulin therapies accounted for $3.7 billion in 2012 and $8.7 billion in 2017 (135% increase). The costliest noninsulin therapies were dipeptidyl peptidase-4 inhibitors (DPP-4i), which increased from $1.5 billion to $3.9 billion (156% increase). The next 2 costliest noninsulin therapies were the glucagon-like peptide-1 receptor agonists (GLP-1RA) and the sodium-glucose cotransporter-2 inhibitors (SGLT2i). Total spending on GLP-1RA increased from $374 million on 753 855 prescriptions in 2012 to $2.6 billion on 2.7 million prescriptions in 2017. In 2014, Medicare Part D spent $165 million on 381 093 SGLT2i prescriptions, which increased to $1.2 billion on 2 million SGLT2i prescriptions in 2017.
[Discussion] Spending for DM-related therapies is rising rapidly among Medicare beneficiaries in the US. Although insulins, primarily analog insulins, remain the primary drivers of cost, overall insulin expenditure growth appears to be slowing. In contrast, spending on newer antihyperglycemic therapies is increasing, driven by not only greater uptake, but also longitudinal increases in per-claim costs of DPP-4i, GLP-1RA, and SGLT2i. The DPP-4i class remains the most costly noninsulin therapy despite lack of established cardiovascular benefits and only modest glycemic efficacy.
Increased aggregate spending has not been accompanied by apparent improvements in population-level glycemic control. However, it is uncertain whether greater use of SGLT2i and GLP-1RA, classes with proven cardiovascular benefits, may still advance value by averting downstream complications and health care expenditures.”
Trends in Aggregate Use and Associated Expenditures of Antihyperglycemic Therapies Among US Medicare Beneficiaries Between 2012 and 2017, JAMA Internal Medicine, 2019.9.30
“Emergency departments backstop outpatient and unanticipated care by performing complex diagnostic workups and therapies, particularly during “WHEN hours” (weekends, holidays, evenings, and nights), which comprise roughly 75% of the hours of the year. The expense to achieve the societal expectation of diagnostic precision and response at all hours of the day should surprise no one. Although it would seem preferable for people with potential “nonemergency” complaints to be seen in primary care, this assumes the ability of primary care practices to accommodate same-day patients, a challenge for many practices. Such complaints are often indistinguishable from conditions requiring immediate emergency care or hospital admission.
[..] Emergency medicine must fulfill an unenviable task: manage the overflow of the health care system while treating time-critical illnesses. The specialty faces what is known as a multi-objective optimization problem. Varying goals constrain feasible solutions and impede the best returns for any single objective. These goals range from accommodating increasing patient volume, pressures to minimize costs, error avoidance, maximizing efficiency and safety, improving patient and staff satisfaction, social justice, and medical education, while retaining the capacity to address large-scale disasters.
[..] In the face of multiple demands, those with a cursory appreciation of systems design may presume that emergency use and hospitalization are inherently bad. However, practices that stem from simplistic logic can introduce unintended consequences in such a complex system.
Although saddled with formidable tasks, EM [emergency medicine] has remained resilient. However, EM’s successes obscure its fragility, systemic failures of the health care system to evolve, avoidance of inconvenient truths (eg, the lack of an integrated health care system, an absent mechanism for comprehensive and universal healthcare coverage, an unresolved mental health crisis, disparities in social determinants of illness, the erosion of public health, rural, and primary care infrastructure), and the need to engineer far-reaching change. Continuing operations that are already at the breaking point, with further demands and interruptions, admission barriers, and frequent excursion beyond safe operative conditions currently represent a clear and present danger to patient health outcomes. The individual toll has already emerged—EM has some of the highest rates of physician burnout. We risk quality erosion of what has matured into an essential component of our health care system. Reframing EM within the care continuum will require the collective and constructive efforts of diverse stakeholders and thoughtful financial, social, cognitive, and organizational investments.”
Reflections on Mortality and Uncertainty in Emergency Medicine, JAMA Internal Medicine, 2019.11.4
“[Introduction] Although the FDA’s medical device reporting regulations require that device-user facilities report adverse events to the FDA, physician reporting is voluntary.3 Adverse event data may be recorded in registries such as the Transcatheter Valve Therapy database,4 which gathers national data on interventional cardiology devices. However, the Transcatheter Valve Therapy registry does not make its data publicly available, which limits its value. Instead, the Transcatheter Valve Therapy registry submits reports to the FDA in summaries that may omit redacted information and obscure important data. Publicly accessible adverse event reports are housed in the FDA’s Manufacturer and User Facility Device Experience (MAUDE) database, where they are classified as malfunction, injury, or death events. We examined the misclassification of death reports for the Sapien 3 and MitraClip devices (high-risk interventional cardiac devices that were approved by the FDA in 2013 and 2015, respectively) within the MAUDE database.
[Results] Sapien 3: We found 9320 injury and malfunction reports for the Sapien 3 device and 1021 reports of deaths; 217 (2.3%) of the injury and malfunction reports also stated that the patient had died during or after the implantation of the device. In addition to directly using the word died, the most commonly used terms in these reports to describe the death of a patient were expired, passed away, and autopsy. Thus, misclassified reports made up 217 of 1238 (17.5%) total patient deaths.
MitraClip: We found 5323 injury and malfunction reports for the MitraClip device and 295 reports of deaths; 97 (1.8%) of the injury and malfunction reports also stated that the patient had died. Terms used in injury and malfunction reports to describe patient deaths included expired, hospice, and passed away. Thus, 97 of 392 (24.7%) patient deaths were misclassified as injury or malfunction events.”
Miscategorization of Deaths in the US Food and Drug Administration Adverse Events Database, JAMA Internal Medicine, 2019.10.7
“In May 2019, the California State Senate passed a bill that relates directly to the issue addressed in this study. Under SB55, a gun owner’s permit would be revoked for 10 years after conviction (depending on the specifics) for 2 or 3 misdemeanors involving alcohol, such as DUI, disorderly conduct while under the influence, or public intoxication. As of September 2019, the bill was pending before the California State Assembly. The California State Legislature passed a similar bill in 2013, but then-Governor Jerry Brown vetoed the measure.
There is no doubt that alcohol and firearms are a dangerous mix. Consuming alcohol increases an individual’s risks of being injured or killed by a firearm and impairs the ability to safely operate a firearm. Drivers with recidivist DUI convictions are at an increased risk for problematic alcohol use. Thus, DUI convictions are a reliable marker of problematic alcohol use, which is in turn associated with risks of victimization and perpetration of firearm violence. Kagawa et al1 show that these 3 features—DUI, problematic alcohol use, and risks for firearm violence—converge within individuals and are observable as increased risks for firearm violence among those with prior DUI convictions.
These findings unmistakably support the pending California DUI convictions legislation. However, of the 79 678 individuals who purchased firearms in the state during the study period, only 1511 (1.9%) had a prior DUI conviction, and only 237 (0.3%) had the 2 or more convictions that would have prevented them from buying a firearm under the new legislation. Although these percentages may seem small, national expansion of such a law in the United States has the potential to avert larger numbers of acts of firearm violence. Such a federal law would also decisively signal that, as a nation, we are as intolerant of mixing alcohol and firearms, so-called drunk firing, as we are of drunk driving.”
Reducing Gun Violence Using Alcohol-Related Convictions: “Never Use Alcohol, Over-the-Counter Drugs, or Prescription Drugs Before or While Shooting”, JAMA Internal Medicine, 2019.9.30
“[Methods] Our sample included 244 BPCI hospitals in 123 BPCI markets during the BPCI period, with 10,757 BPCI patients per quarter in the early BPCI period and 10,949 in the late BPCI period. Our matched comparison group consisted of 244 non-BPCI hospitals operating in 98 non-BPCI markets during the BPCI period. There were 2,819 non-BPCI patients per quarter at non-BPCI hospitals in the early BPCI period and 2,375 in the late BPCI period. Wald tests did not indicate divergent secular trends between BPCI and non-BPCI patients during the pre-BPCI period.
[Results] In an adjusted difference-in-differences analysis that used the instrumental variable, LEJR among patients admitted to BPCI hospitals was associated with a 1.6 percent differential decrease (of approximately $377) in episode spending before versus after hospitals initiated BPCI participation, as compared to changes for patients admitted to non-BPCI hospitals (exhibit 3). In the early BPCI period, BPCI participation was associated with a 1.8 percent differential decrease in mean episode spending. In contrast, BPCI participation was not associated with significant changes in mean episode spending for the late BPCI period.”
Spending And Quality After Three Years Of Medicare’s Voluntary Bundled Payment For Joint Replacement Surgery, Health Affairs, 2020.1.6
“Our findings have four important implications for policy makers debating the further implementation and expansion of bundled payment programs. First, the current state of evidence suggests that for LEJR [lower extremity joint replacement], bundled payment encourages hospitals and physician practice groups to provide cost-efficient care without compromising quality. By demonstrating that the quality of care remained the same or increased while costs decreased, the existing evidence from the BPCI and CJR models suggests that LEJR episodes may meet the criteria for expansion [..].
[..] we found that for certain clinical episodes, such as spinal fusion procedures, bundled payment was not associated with cost savings because of unusually high baseline patient complexity—which likely influenced the care provided by postacute care facilities and home health agencies in such populations. Given the penalty for cases that exceed the bundled payment target price, providers may be reluctant to accept these patients, which could in turn lead to decreased access to care. Studies have suggested that CMS needs to include more robust risk stratification of patients in bundled payment programs to allow higher payments for more complex patients and to more fairly judge the performance of providers who care for them.
[..] The BPCI Advanced program is a new iteration of voluntary bundled payment that started in October 2018. This program will generate new data about bundled payment by adding outpatient episodes and engaging new specialty types in advanced alternative payment models. The evidence to date suggests that the current bundled payment design is conclusively well suited to only one clinical episode—LEJR [lower extremity joint replacement]—and may require changes to produce better value for patients with other conditions [spinal fusion procedures, revised joint arthroplasty and medical conditions were tested, but no savings identified]. [..] Furthermore, because voluntary bundled payment models are more popular than mandatory models, future work should consider the type and amount of financial reward needed to attract more participants. Lastly, most of the available evidence on bundled payment programs is from acute care hospitals, and more evidence is needed on physician group practice participants.”
The Impact Of Bundled Payment On Health Care Spending, Utilization, And Quality: A Systematic Review, Health Affairs 2020.1.6
2020.1.6
Jackson Williams, vice-president for public policy at Dialysis Patient Citizens, suggests several approaches to challenge surprise medical bills:
1. Trigger a collection lawsuit by filing a pleading in response to the lawsuit. The burden is on the provider to prove the service was delivered to the patient and demonstrate the value of the service.
2. Contest the charges with credit reporting agencies, entities that place the onus of verifying the debt on the service provider (something Medicare and private payers do not usually do).
3. Utilize the courts’ stance that support the prevailing price in the market when there is no agreement between parties on the price for a service (e.g., reading an x-ray or administering anesthesia).
4. Challenge hospitals’ non-profit tax exemption status.
3 legal challenges could derail out-of-network surprise medical bills, STAT, 2020.1.6
2020.1.5
The author, a novelist, refers to Ian McCammon’s 2004 paper “Heuristic Traps in Recreational Avalanche Accidents: Evidence and Implications.” The paper outlines six heuristic traps: familiarity (failing to remain vigilant when faced with the unknown), social facilitation (everybody’s doing it, so it must be OK), expert halo (the experts must know what they’re doing, and so it’s safe to unquestionably follow them), consistency (every moment you don’t turn around for home, it becomes harder to do so), scarcity, and acceptance (peer pressure).
The author’s instructor suggested that avoiding all of these traps require group decision-making, constant communication and regular practice in emotional vulnerability. In avalanche decisions, all-female groups make better decisions than all-male or mixed-gender groups.
There are five avalanche danger ratings: low, moderate, considerable, high and extreme. When the avalanche danger is “high,” fewer people are killed, because people on high-danger days are certain about their uncertainty. “Considerable” danger requires that people deal with their uncertainty about their uncertainty. Most accidents happen when the avalanche danger is “considerable.”
The author notes that when people are together, individual risk thresholds become destabilized, leading some to assume a level of risk that, alone, they never would.
Thoughts to ponder as we consider healthcare interventions on the border between kind learning (learning from mistakes with no reprecussions from those mistakes) and wicked learning (mistakes impair someone’s quality-of-life or even terminate their life).
What I Learned in Avalanche School, New York Times Magazine, 2020.1.2
2020.1.4
“[Introduction] There are no pharmacotherapies approved for methamphetamine use disorders [..]. Mirtazapine is a generic US Food and Drug Administration–approved antidepressant with no apparent abuse potential, onset of action within 2 weeks, and notable adverse effects of somnolence and weight gain.
[Discussion] mirtazapine significantly reduced positive results of methamphetamine urine testing [..]. [..] we observed significant reductions in some but not all sexual HIV risk behaviors and not until 24 weeks of treatment. This difference may be attributable to [..] the evolving landscape for HIV prevention while this trial was being conducted, marked by scaling up of preexposure prophylaxis and messaging that “an undetectable [HIV viral load] is untransmissible.”
[..] Mirtazapine was efficacious in the setting of suboptimal adherence. [..] long-acting formulations or paired technological or behavioral interventions could be explored to facilitate adherence. Furthermore, the reduction in use was modest overall and not significant with regard to analyses based on abstinence; it is conceivable that a combination approach could result in further reduction in use.”
Effects of Mirtazapine for Methamphetamine Use Disorder Among Cisgender Men and Transgender Women Who Have Sex With Men: A Placebo-Controlled Randomized Clinical Trial, JAMA Psychiatry, 2019.12.11
2020.1.3
“Daytime television talk shows, popular podcasts and diet books on the New York Times best-seller list would have you believe that being healthy is complicated. You need to eat the latest superfood, buy the perfect supplements or join the hippest fitness cult. These theories are particularly popular right now, as people commit to New Year’s resolutions.
But after practicing family medicine for 16 years, with a focus on nutrition and obesity, I’ve learned that the keys to good health are quite simple to describe. In fact, I believe the best health advice can be boiled down to 48 words.
So what are these 48 words? In no particular order:
-Don’t smoke.
-Get vaccinated.
-Avoid trans fats.
-Replace saturated fats with unsaturated if you can.
-Cook from whole ingredients — and minimize restaurant meals.
-Minimize ultraprocessed foods.
-Cultivate relationships.
-Nurture sleep.
-Drink alcohol at most moderately.
-Exercise as often as you can enjoy.
-Drink only the calories you love.”
How to Be Healthy, in Just 48 Words, New York Times, 2020.1.3
“The data set includes, whether they know it or not, every one of the 300,000 patients who visited Moorfields between 2008 and 2018 and was over the age of 40—though names and other easily identifiable information are not preserved. The idea is to examine changes to people’s eyes within that ten-year period, and correlate these with [..] disease in the same patient. [..] It took the doctors two and a half years to go through a series of ethics-committee approvals [..]
[..] If it does work, the technique the two researchers are proposing will be cheap to implement. An indication of how cheap is the project’s total budget of just £15,000 (about $19,000). Equipment to perform an eye scan is becoming ubiquitous. Specsavers, which runs a chain of high-street opticians, now routinely offers the same sort of scans as Moorfields’ in half of its 800 branches. Costco, a bulk retailer, offers scans in Britain for £24.99 a pop. An Israeli company called Notal Vision is building an eye-scanning device that is small enough to operate at home. The equipment and algorithms required to run machine learning on an eye scan are available to anyone, through cloud-computing services like Google and Amazon. Dr Keane once joked that he would like to see eye-scanning widgets become so cheap that they could be bundled in boxes of cereal.
This project will also act as a model for linking disparate health data together in a useful way while respecting patients’ rights. Other such endeavours involving information-technology firms handling health data, such as Google’s work with Ascension hospitals in America, or other parts of its subsidiary DeepMind’s work with England’s health service, have generated controversy because they offered no notice of their plans to patients. As well as jumping deftly through all the required legal and ethical hoops, Drs Wagner and Keane also posted notices around the hospital and on Moorfields’ website, informing patients of the impending linkage. Besides explaining what was happening, these also noted the research’s potential benefits. Not one person complained.”
A system based on AI will scan the retina for signs of Alzheimer’s: And, after that, of stroke susceptibility and heart disease, The Economist, 2019.12.18
2020.1.2
“[Results] The mean (SD) participant age was 40 (16.5) years and 122 929 of 158 083 encounters (78%) involved female patients. The 158 083 encounters resulted in 281 165 reported symptoms, with 204 958 symptoms having identifiable organ systems and 279 948 having identifiable concern types. The most common organ system concerns were related to reproductive (37 669 of 204 958 reported symptoms [18%]), general (34 120 of 204 958 reported symptoms [17%]), and gastrointestinal (30 994 of 204 958 reported symptoms [15%]) systems. The most common symptom types were pain (122 363 of 279 948 reported symptoms [44%]), abnormal functioning (62 949 of 279 948 reported symptoms [22%]), and discharge (21 622 of 279 948 reported symptoms [8%]). The most common preencounter intended level of care was primary care (73 546 encounters [47%]), followed by uncertain (53 649 encounters [34%]), urgent (14 928 encounters [9%]), and emergency (14 813 encounters [9%]). We found that the proportion of patients who were uncertain about the level of care decreased from 34% to 21% (difference, 13.4%; 95% CI, 13.1%-13.7%). Among patients who chose preencounter and postencounter intended level of care (ie, did not select “uncertain”), we found that in 28 961 interactions (32%), patients reduced the urgency of their intended level of care; in 58 844 (65%), urgency remained the same; and in 3243 (4%), urgency increased (χ215 = 77936.6960; P < .001).
[Discussion] In this data set of more than 150 000 patient interactions with an online triage tool, the urgency of patients’ intended level of care decreased in more than one-quarter of the cases and increased in approximately 1 in 20 cases, with the remaining patients remaining at the same level. The study suggests that virtual triage tools are associated with patients’ intended behavior when seeking care based on triage questions. Reduced urgency of intended level of care for many interactions is different from many other direct-to-consumer telehealth solutions, which have reported the same or an increased demand for care services.
This preliminary research has several limitations. We only included patient interactions that provided postencounter intention data. We only have information within the context of patient-tool interactions and were not able to observe whether users had multiple interactions, whether behavior was affected, or the appropriateness of the triage results.”
Association of Use of Online Symptom Checkers With Patients’ Plans for Seeking Care, JAMA, 2019.12.27
2019.12.21
“It is vital to look beyond the statistical robustness of a risk-adjustment model, particularly for outcome measures that are used for public comparisons of hospital performance. Such programs (eg, public reporting, pay for performance) are designed to provide information to consumers and to hold hospitals accountable to improve specific health outcomes. Baker and Chassin have described 4 key tests that should be applied to such outcome measures. Examining the specific outcome of hospital mortality against these 4 criteria reveals serious weaknesses in the mortality measures that are in common usage today.
[..] The first criterion posits that strong evidence exists that the outcome can be improved by good medical care. If improving medical care cannot improve the outcome, then it is inappropriate to hold hospitals accountable for that outcome. The time frame over which improvement is expected is also important. For the most common measure of hospital mortality (death within 30 days of admission), in some cases (eg, heart failure) good medical care does improve survival, but that improvement typically takes longer than 30 days. In other cases, good medical care improves outcomes other than mortality. In patients with ischemic stroke, prompt treatment with thrombolytic therapy or mechanical thrombectomy improves functional outcomes but not mortality.
The second criterion is that the outcome measure should have a high degree of accuracy. Although hospital mortality can usually be accurately measured, it can be difficult to identify all patients with the target condition for the measure. In the case of pneumonia, research discovered that increasing proportions of inpatients with pneumonia were being assigned a principal diagnosis of sepsis or respiratory failure and not being included in calculations of hospitals’ 30-day mortality rate for pneumonia, thereby artificially lowering that mortality rate. While the US Centers for Medicare & Medicaid Services has taken steps to mitigate this problem for Medicare’s pneumonia measure, it is not clear whether similar problems exist for other hospital mortality measures.
The third criterion examines the reliability and validity of the risk adjustment that is necessary when comparing hospitals on their mortality rates for specific conditions. All important risk factors must be measured accurately and included in the risk-adjustment model to enable fair comparisons across hospitals. These risk factors fall into 2 categories: those that assess the severity of the condition being measured and those that assess comorbid conditions that are present along with the primary condition. Factors associated with severity of a condition are the strongest predictors of mortality. Statistically speaking, the odds ratios attached to risk factors associated with severity are consistently higher than those for risk factors associated with comorbid conditions.4 In a study of acute myocardial infarction, the only risk factors with odds ratios more than 2 were those associated with the severity of the acute myocardial infarction.5 The best-performing risk-adjustment models typically include risk factors that assess both comorbidities and severity.
Unfortunately, no risk-adjustment models based on data from hospital billing (claims) systems contain any risk factors associated with severity. The effect of this omission can be substantial.[..]
The fourth criterion is that the outcome measure should provide minimal likelihood of causing unintended adverse effects. Most often, this criterion is directed at adverse effects on patient care. In this case, however, the measure itself is adversely affected by an unintended consequence. Claims data are subject to the vagaries of changes in rules meant to improve billing practices but which may have unintended adverse effects when claims data are used in risk-adjustment models. [..] As of January 2011, the Centers for Medicare & Medicaid Services permitted hospitals to increase the number of diagnoses submitted with their Medicare hospital claims from a previous maximum of 10. In January 2011, fully 70% of hospital admissions claims reported 11 or more diagnoses.8 Just as Silva and colleagues1 observed with the Veterans Health Administration data, research found that increasing the number of comorbid conditions listed on a hospital claim led to an artificially elevated level of predicted risk and, in this case, to an artificially lowered risk-adjusted readmission rate.8 The researchers concluded that because of this phenomenon, any reductions in readmission rates that occurred following the institution of the Centers for Medicare & Medicaid Services’ program were “illusory or overstated.”8 Any effects of this rule change on Medicare’s claims-data–only risk adjustments of hospital mortality are unclear.”
Getting Better at Measuring Hospital Mortality, JAMA Intern Med, 2019.12.20
2019.12.20
“By the 1970s and 1980s systems began using rule-based artificial intelligence and cognitive theory. These systems led students through each step of a problem, giving hints from expert knowledge bases. But rule-based systems failed because they were not scalable — it was expensive and tedious to program extensive domain expertise.
Since then, most computer teaching systems have been based on decision trees, leading students through a preprogrammed learning path determined by their performance — if they get a question right, they are sent in one direction, and if they get the question wrong, they are sent in another. The system may look like it is adapting to the student, but it is actually just leading the student along a preset path.
But the machine-learning revolution is changing that. Today, learning algorithms uncover patterns in large pools of data about how students have performed on material in the past and optimize teaching strategies accordingly. They adapt to the student’s performance as the student interacts with the system.
[..] Studies show that these systems can raise student performance well beyond the level of conventional classes and even beyond the level achieved by students who receive instruction from human tutors. A.I. tutors perform better, in part, because a computer is more patient and often more insightful.
[..] Still more transformational applications are being developed that could revolutionize education altogether. Acuitus, a Silicon Valley start-up, has drawn on lessons learned over the past 50 years in education — cognitive psychology, social psychology, computer science, linguistics and artificial intelligence — to create a digital tutor that it claims can train experts in months rather than years.
[..] The world will still need schools, classrooms and teachers to motivate students and to teach social skills, teamwork and soft subjects like art, music and sports. The challenge for A.I.-aided learning, some people say, is not the technology, but bureaucratic barriers that protect the status quo.”
The Machines Are Learning, and So Are the Students, New York Times, 2019.12.18
In August 2019, LocumTenens.com surveyed locum tenens and full-time, permanent physicians and advance practitioners to inquire about their annual salary and bonuses.
The 2018 average physician salary was $363,924 (up 16.5% from 2015). The top three specialty salaries were orthopedic surgery ($539,464), cardiololgy ($469,895) and radiology ($434,541).
The 2018 average advanced practitioner salary was $122,973 (down from 2016, but slightly higher than 2017). The top three specialty salaries were certified nurse anesthetist ($202,244), emergency medicine physician assistant ($166,194) and emergency medicine nurse practitioner ($142,857).
*The report bundled internal medicine, family medicine and pediatrics into “primary care.” The 2018 average physician salary for that group was $245,146. Within that group, the average internal medicine salary increased about 22% since 2016, but the average family medicine salary dropped 8% last year (I see patients in an outpatient internal medicine clinic).
2019 Physician and Advanced Practice Salary Report: What are physicians and advanced practitioners making?, FierceHealthcare, 2019.12.19
“[Abstract]
Objective: The study sought to describe the literature describing clinical reasoning ontology (CRO)–based clinical decision support systems (CDSSs) and identify and classify the medical knowledge and reasoning concepts and their properties within these ontologies to guide future research. [..]
Results: We included 38 CRO-based CDSSs for the analysis. Diversity of the purpose and scope of their ontologies was seen, with a variety of knowledge sources were used for ontology development. We found 126 unique medical knowledge concepts, 38 unique reasoning concepts, and 240 unique properties (137 relationships and 103 attributes). Although there is a great diversity among the terms used across CROs, there is a significant overlap based on their descriptions. Only 5 studies described high quality assessment.
[Manuscript]
Introduction: [..] The Open Biological and Biomedical Ontology (OBO) Foundry, a collective that provides access to biological, biomedical, and clinical related ontologies, could be a potential source for a CRO. However, the ontologies in OBO tend to focus on a specific aspect of clinical entities rather than cognitive processes. For example, the Human Disease Ontology classifies human-related diseases according to their etiology and provides a standardized ontology of disease and phenotypic terms that allow for semantic mapping of diseases across existing vocabularies. Other ontologies, such as the Cardiovascular Disease Ontology, focus on specific disease processes. Although OBO lists several such ontologies, an ontology encapsulating the “reasoning concepts” behind the clinical decision across overall patient-clinician encounter without restricting to a specific disease entity does not exist.
Results: [..] Thirty CDSSs (79%) used rule-based computation for inferencing, 22 (58%) used an ontology-based method, 6 (16%) used algorithms, 3 (8%) used natural language processing, 3 (8%) used machine learning, and 2 (5%) used fuzzy logic. Other computational methods included probability, proximity-based, anchor-based, and ranking of weighted option. Twenty (5 ontology-based and 15 rule-based) CDSSs used only 1 computational method.
A wide range of medical domains were addressed by the CDSSs: 12 dealt with management of chronic diseases (5 diabetes, 1 hypertension, 1 heart failure, and 5 multiple chronic diseases), 6 with cancer management (4 breast cancer and 2 general cancer treatment), 3 with cardiac-related conditions, 3 with medication management and adverse events, 3 with general clinical guidelines, 2 with radiology, 2 with diagnosis, and 7 with others (1 each of preoperative risk, infectious disease, glenohumeral joint rehabilitation, spondylarthritis treatment, healthcare teams, diagnosis and treatment, blood transfusion).”
Using clinical reasoning ontologies to make smarter clinical decision support systems: a systematic review and data synthesis, JAMIA 2019.10.8
2019.12.19
“The powerful corporate interests that stalled major action on both drug pricing and surprise billing have similar arguments: if patients are insulated from immediate financial pain, the public outrage will be relieved. However, healthcare policy experts say that structural reform is needed beyond a narrow focus on out-of-pocket spending, because taxpayers ultimately foot the bill for payment arrangements behind the scenes.
Drugmakers and hospitals acknowledged that the funding deal did not contain consumer protections and committed to work with Congress moving forward.
The branded-drug industry said it supported passing the Creating and Restoring Equal Access To Equivalent Samples (Creates) Act, and maintained that the problem is patients’ out-of-pocket costs, not drug list prices.
[..] Provider groups, which ultimately stalled action on surprise medical billing, argue that they want patients to be held harmless from surprise bills. But they refused to support a compromise package from Senate health committee Chair Lamar Alexander (R-Tenn.) and leaders of the House Energy and Commerce Committee that included several provider-friendly tweaks.
[..] House Energy and Commerce ranking Republican Greg Walden of Oregon expressed regret that politics got in the way of passing a bipartisan, bicameral bill that had support from the White House and committed to pushing the bill in 2020.
But legislative prospects in the thick of campaign season are dim, and House and Senate leaders have shown no appetite to force their members to vote on an issue that divides powerful interests.
“There’s a promise that we’ll get you next time, but a May time frame is an abysmal time to make major bipartisan legislation,” [senior director of federal relations at consumer advocacy group Families USA Shawn] Gremminger said.”
Healthcare consumers are the big losers in year-end funding deal, Modern Healthcare, 2019.12.18
“as a consultant I’ve seen the detailed information about individual hospitals and doctors that’s available to some insurers. While a few plans do a good job of sharing meaningful data, most settle for limited information posted in a dusty corner of their website.
Given health insurers’ negative image – in one national poll, just 16 percent of respondents believed insurers put people over profits –why don’t health plans highlight these kinds of valuable services? Here’s where consumerism confronts unpleasant realities.
Take cancer consults. While a world-class second opinion may save money in the long run, if everyone who thinks they’re a cancer risk joins your plan, that “adverse selection” among the enrolled population could boost medical expenses.
When it comes to publicizing the use of algorithms to predict illness, the adverse selection problem is complicated by the additional issue of public trust. Even though early intervention can save money, will members believe that a company that gained national notoriety for denying claims for emergency room visits – as Anthem did – has their best interests at heart when it comes to their heart? Other plans have similar trust issues.
[..] Plans should answer carefully defined questions in three areas: What will you do to keep me well? What information will you give me about doctors and hospitals? And what resources do you offer in case of serious illness?”
*UnitedHealth Group, my employer, competes with Anthem in multiple health insurance markets.
Will Your Health Plan Tell You That It Can Save Your Life?, Forbes, 2019.12.18
“The CMS suspended access to the Blue Button 2.0 API, or application programming interface, after a third-party app developer reported a “data anomaly” on Dec. 4. It’s unclear when the service, which allows Medicare beneficiaries to share their claims data with third-party apps, will be restored [..]
The bug—a coding error that was added last year—may have inadvertently shared some beneficiaries’ protected health information with an incorrect user or to an incorrect Blue Button 2.0 app.
“The technical issue is contained to less than 10,000 Blue Button authorized users and 30 authorized apps,” a CMS spokesperson wrote in an emailed statement.
[..] An identity management system assigns beneficiaries randomly generated user IDs to connect claims data to the correct third-party app. However, the Blue Button 2.0 tool was truncating user IDs to be shorter in length, which made them “not sufficiently random to uniquely identify a single user, ” according to the CMS’ blog post, leading the same shorted user IDs being assigned to multiple people.
That means any data exposure from the bug was contained to Blue Button 2.0 beneficiaries and developers, and does not involve intrusions by outside entities, according to the CMS.”
Blue Button 2.0 bug may have exposed Medicare beneficiary data, Modern Healthcare, 2019.12.18
“the single-payer solution promises to make health care more accessible. But it won’t necessarily make health care better or more affordable. The Congressional Budget Office says costs to taxpayers for any such program would be astronomical and whether it would improve health will take years to determine.
By contrast on-site and near-site employer-based clinics are a proven concept for improving the quality and affordability of care. Centered on primary care, the model disrupts health care from the inside, thwarting the perverse incentives that sometimes bankrupt patients and cause them to skip needed care.
Unlike Medicare for All, this model needs neither presidential support nor a law passed by Congress.
[..] One-third of U.S. employers with 5,000 or more workers now offer on-site and near-site health clinics, up from 17% in 2007. Such clinics are showing strong growth among employers with 500 to 4,999 employees, too, with 16% currently providing a medical clinic for employees and another 8% considering adding one in 2019.
One reason for the growth is the potential ROI—up to $1.50 for every dollar invested. South Bend Community School Corp. has achieved a cumulative ROI of $1.60 from its clinic in the five years since its inception.
Changing the health care system makes for a lively political debate. But affordable, quality primary care is the key to getting the outcomes we want. The best on-site and near-site health clinics improve health, reduce total healthcare costs by 10-25% and provide an exceptional benefit for employees and their family members.”
*The author, Debra Geihsler, principal at Activate Healthcare, was previously the CEO of Advocate Medical Group, the medical group through which I see patients.
Industry Voices—’Medicare for All’ might work. Here’s what definitely does, FierceHealthcare, 2019.12.18
“Methods: The study population data were drawn from the Behavioral Risk Factor Surveillance System, a telephone survey administered by state health departments with assistance from the Centers for Disease Control and Prevention. [..] General, physical, and mental health were measures addressed in the survey. All individuals 60 years and older surveyed cross-sectionally between 2003 and 2017 who reported all 3 health measures (<3% missing) were included for a total sample size of 2,432,609. [..] These cross-sectional samples were of the US population over time, not individuals followed over time. General health was assessed with the question, “Would you say that in general your health is” with response options of “excellent,” “very good,” “good,” “fair,” “poor,” “don’t know/not sure,” or “refused.” Physical health was assessed with the question, “Now thinking about your physical health, which includes physical illness and injury, for how many days during the past 30 days was your physical health not good?” with response options in number of days. Mental health was assessed with the question: “Now thinking about your mental health, which includes stress, depression, and problems with emotions, for how many days during the past 30 days was your mental health not good?” with response options in number of days.
Results: [..] General health and physical health improved or were stable in all age groups 65 years and older from 2003 to 2017.

[..] A more substantial decrease in mental health problems, measured as days per month with illness, occurred for those in groupings aged 60 to 64 (2.9 days for 2003 and 3.6 days for 2017), 65 to 69 (2.3 days for 2003 and 3.0 days for 2017), and 70 to 74 (2.2 days for 2003 and 2.4 days for 2017). The groups aged 60 to 64 and 65 to 69 years had a significant decrease in mental health over this period (3.5% increase in number of mentally unhealthy days per year; t = 14.01 [P < .001]). The surveys did not include specific questions about memory decline, which may also be important.
Mental health trends varied by gender, income, and education across the range of the population aged 60 years and older.
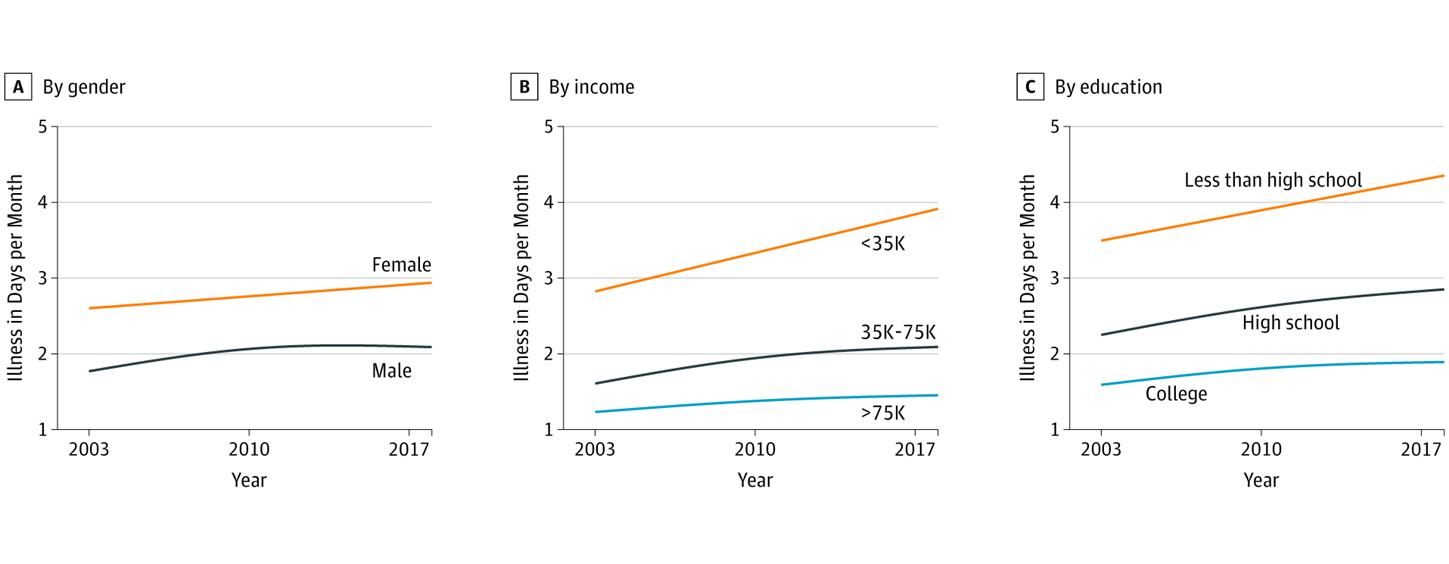
Decreases in reported mental health, measured as days per month of illness, were similar for men and women, but greater for those with lower levels of income and those with less than a high school level of education.”
Trends in Mental and Physical Health-Related Quality of Life in Low-Income Older Persons in the United States, 2003 to 2017, JAMA Network Open, 2019.12.18
2019.12.18
Excerpt – It’s a mistake to repeal the so-called Cadillac tax, which has never actually been collected, because it would have made the tax code more progressive and health insurance more affordable. By contrast, eliminating the medical-device tax, which was in effect only from 2013 to 2015, is a sensible move that will encourage growth and sacrifice little revenue.
[Cadillac tax] would have been imposed on expensive insurance plans, some of which pay for services that are not generally considered medical necessities. These plans are both tax deductible for employers and tax-free for employees. Thus they serve as a way for companies to effectively increase compensation without them or their employees paying any tax.
These types of extravagant plans are typically enjoyed by well-compensated employees, so the Cadillac tax would have been progressive. Perhaps more important, such plans increase the demand for medical services overall, driving up the cost of health care. The Cadillac tax would have discouraged companies from choosing these types of plans, thus lowering the price of insurance for everyone else.
[Medical-device tax] many medical-device manufacturers are small companies with little market power compared to the large hospital groups they do business with. Those companies would be forced to pay the tax, eating into their profit margin.
Larger manufacturers would be able to pass the tax along to hospitals, patients and, ultimately, insurance companies. Insurance companies would respond by raising prices. Because Obamacare subsidizes many insurance plans with tax credits, this would result in more spending by the federal government.
Save Obamacare’s Cadillac Tax: Congress is set to repeal the tax, which would have made health insurance more affordable, Bloomberg Opinion, 2019.12.17
Excerpt – we introduced last year Amazon Comprehend Medical, a HIPAA eligible natural language processing service that makes it easy to use machine learning to extract relevant medical information from unstructured text. Using Comprehend Medical, you can quickly and accurately gather information, such as medical condition, medication, dosage, strength, and frequency from a variety of sources like doctors’ notes, clinical trial reports, and patient health records.
[..] An ontology provides a declarative model of a domain that defines and represents the concepts existing in that domain, their attributes, and the relationships between them. It is typically represented as a knowledge base, and made available to applications that need to use or share knowledge. Within health informatics, an ontology is a formal description of a health-related domain.
The ontologies supported by Comprehend Medical are:
- ICD-10-CM, to identify medical conditions as entities and link related information such as diagnosis, severity, and anatomical distinctions as attributes of that entity. This is a diagnosis code set that is very useful for population health analytics, and for getting payments from insurance companies based on medical services rendered.
- RxNorm, to identify medications as entities and link attributes such as dose, frequency, strength, and route of administration to that entity. Healthcare providers use these concepts to enable use cases like medication reconciliation, which is is the process of creating the most accurate list possible of all medications a patient is taking.
[..] You can use Amazon Comprehend Medical via the console, AWS Command Line Interface (CLI), or AWS SDKs. With Comprehend Medical, you pay only for what you use. You are charged based on the amount of text processed on a monthly basis, depending on the features you use. For more information, please see the Comprehend Medical section in the Comprehend Pricing page. Ontology Linking is available in all regions were Amazon Comprehend Medical is offered, as described in the AWS Regions Table.
The new ontology linking APIs make it easy to detect medications and medical conditions in unstructured clinical text and link them to RxNorm and ICD-10-CM codes respectively. This new feature can help you reduce the cost, time and effort of processing large amounts of unstructured medical text with high accuracy.
Amazon Web Services news blog, 2019.12.16
Excerpt – “Traits” refer to relatively consistent ways of thinking, behaving, and feeling across situations. “Values” represent the things in life that are most important to a person. A number of measurable schema of traits and values exist; here we focus on “the Big 5,” which classify traits into 5 broad factors (extraversion, agreeableness, conscientiousness, emotional stability, and openness), and 5 of Schwartz’s “basic values,” which identify personal values that are generally recognized across cultures (helping others, tradition, taking pleasure in life, achieving success, excitement).
[..] As people engage with social media, they leave behind digital fingerprints—behavioral traces of their personality—which can be detected at a large scale. Linguistic analyses of social media information have been used to predict an array of outcomes, including age, gender, political orientation, physical and mental illness, and unemployment. However, associations between these factors and career success across a broad range of occupations are unknown.
[..] Using a large dataset, information unobtrusively available online (i.e., Twitter language), and a combination of Big 5 traits and 5 basic values, our study suggests that personality digital fingerprints relate to distinctive occupations. Our analytic approach potentially provides an alternative for identifying occupations which might interest a person, as opposed to relying upon extensive self-report assessments. Notably, while many of the occupations that clustered together are intuitively related, occupations that rely on similar skill sets and interests that are not traditionally part of an occupational category may point to alternative vocations that might provide good matches for a person.
Our results demonstrate the potential to create an atlas of career aptitude, based on noncognitive personality traits and values. We anticipate that this could have significant applications in career guidance for new graduates, disengaged employees, career changers, and the unemployed.
Social media-predicted personality traits and values can help match people to their ideal jobs, PNAS, 2019.12.16
2019.12.17
Historically, the health care system has a poor track record of productivity gains, especially compared with other sectors of the economy. In a National Bureau of Economic Research article published in 2011, David M. Cutler, PhD, of Harvard University, reported that productivity growth in health, education, and social services was negative between 1995 and 2005, meaning that instead of doing more and/or costing less, these sectors did less and/or cost more. In comparison, the average across industries was positive 2.4% growth, with durable goods and information technology sectors leading the pack with productivity growth about 7% and 6%, respectively.
[..] However, prior work focused on the amount of health care delivered (like admissions or hospital days) and not on the quality of health it produced. One notable exception is a 2015 study published in Health Affairs, which measured not only how much care hospitals provided but also whether the care they delivered kept patients alive and out of the hospital for at least 30 days. By this measure, hospital productivity grew 14% for heart attacks, heart failure, and pneumonia over the 2002-2011 period—and it grew faster than the overall economy in the last few years of the analysis. Although results like this from 1 study should not be taken as evidence that we have solved the productivity problem in health care, it is an encouraging sign.
[..] Even if the health care system is becoming more efficient in some ways, that doesn’t mean it’s as efficient as it could be or that we’re definitively on the road to driving out all the waste. History suggests that improving productivity in health care is extremely hard and extremely rare.
Making Health Care More Productive, JAMA 2019.12.17
Results: A total of 104,707 participants (21,800 [20.8%] men and 82,907 [79.2%] women) were included. Mean (SD) baseline age of participants was 42.7 (14.5) years. Absolute T2D rates in the lowest and highest UPF consumers were 113 and 166 per 100,000 person-years, respectively. Consumption of UPF [ultra-processed foods] was associated with a higher risk of T2D (multi-adjusted hazard ratio [HR] for an absolute increment of 10 in the percentage of UPF in the diet, 1.15; 95% CI, 1.06-1.25; median follow-up, 6.0 years; 582,252 person-years; 821 incident cases). These results remained statistically significant after adjustment for several markers of the nutritional quality of the diet, for other metabolic comorbidities (HR, 1.13; 95% CI, 1.03-1.23), and for weight change (HR, 1.13; 95% CI, 1.01-1.27). The absolute amount of UPF consumption (grams per day) was consistently associated with T2D risk, even when adjusting for unprocessed or minimally processed food intake (HR for a 100 g/d increase, 1.05; 95% CI, 1.02-1.08).
Conclusions and Relevance: In this large observational prospective study, a higher proportion of UPF in the diet was associated with a higher risk of T2D. Even though these results need to be confirmed in other populations and settings, they provide evidence to support efforts by public health authorities to recommend limiting UPF consumption.
*NOVA, a food classification system based on the extent and purpose of industrial food processing, groups foods into:
- Unprocessed or minimally processed foods – fresh, dried, grounded, chilled, frozen, pasteurized or fermented staple foods such as fruits, vegetables, pulses, rice, pasta, eggs, meat, fish or milk,
- Processed culinary ingredients – salt, vegetable oils, butter, sugar and other substances extracted from foods and used in kitchens to transform unprocessed or minimally processed foods into culinary preparations,
- Processed foods – canned vegetables with added salt, sugar-coated dry fruits, meat products only preserved by salting, cheeses and freshly made unpackaged breads, and other products manufactured with the addition of salt, sugar or other substances of the “processed culinary ingredients” group, and
- Ultra-processed foods – undergo industrial processes notably include hydrogenation, hydrolysis, extruding, moulding, reshaping, and pre-processing by frying. Flavouring agents, colours, emulsifiers, humectants, non-sugar sweeteners and other cosmetic additives are often added to these products to imitate sensorial properties of unprocessed or minimally processed foods and their culinary preparations.
Ultraprocessed Food Consumption and Risk of Type 2 Diabetes Among Participants of the NutriNet-Santé Prospective Cohort, JAMA 2019.12.16
Objective: To compare outcomes of home hospital versus usual hospital care for patients requiring admission.
Design: Randomized controlled trial
Setting: Academic medical center and community hospital.
Patients: 91 adults (43 home and 48 control) admitted via the emergency department with selected acute conditions.
[Eligible diagnoses: Any infection, heart failure exacerbation, COPD exacerbation, asthma exacerbation, chronic kidney disease requiring diuresis, diabetes and its complications, gout exacerbation, hypertensive urgency, previously diagnosed atrial fibrillation with rapid ventricular response, anticoagulation needs (e.g., venous thromboembolism), or a patient at the end of life who desires only medical management]
Intervention: Acute care at home, including nurse and physician home visits, intravenous medications, remote monitoring, video communication, and point-of-care testing.
Results: The adjusted mean cost of the acute care episode was 38% (95% CI, 24% to 49%) lower for home patients than control patients. Compared with usual care patients, home patients had fewer laboratory orders (median per admission, 3 vs. 15), imaging studies (median, 14% vs. 44%), and consultations (median, 2% vs. 31%). Home patients spent a smaller proportion of the day sedentary (median, 12% vs. 23%) or lying down (median, 18% vs. 55%) and were readmitted less frequently within 30 days (7% vs. 23%).
Limitation: The study involved 2 sites, a small number of home physicians, and a small sample of highly selected patients (with a 63% refusal rate among potentially eligible patients); these factors may limit generalizability.
Hospital-Level Care at Home for Acutely Ill Adults: A Randomized Controlled Trial, Annals of Internal Medicine, 2019.12.17
2019.12.16
Excerpt – Originally, the company made a fairly typical pitch, explaining that it could help them lower their blood pressure, shed pounds and stave off diabetes. “It landed with a thud,” says Michael Merino, Encore Wellness / Nifty After Fifty president and CEO.
Merino says the company decided to poll regular customers to find out what kept them coming back. Most said they enjoyed seeing their friends and meeting the staff in the fitness centers. So Encore decided to make its programs more social. It started offering group exercise classes, monthly movie matinees (with free popcorn), Wii bowling competitions, and monthly themed potluck parties. “We’ve transitioned from the fitness place where people also socialize to the social place where people also exercise,” he says. “Either way, we’ve found there’s net more exercise going on and at the end of the day, that’s our objective.”
[..] In a traditional gym, seniors often face an intimidating barrage of loud music, toned bodies in Yoga pants, inattentive trainers, and unfamiliar equipment. At Encore Wellness centers, the machines are easy to use and customized for the needs of seniors. After members are personally evaluated, they’re given an electronic key-card. When inserted into the machines, a display tells the member how many reps to do and at what resistance level.
In addition, each member receives one-on-one attention from specially trained wellness coaches who remain in contact with the member’s physician to discuss their needs and individual progress. If a member doesn’t show up for a scheduled workout, they get a friendly phone call reminding them to show up. “Each workout is computer monitored and personally supervised and constantly evaluated,” says Sheldon Zinberg, a physician who founded both CareMore and Encore Wellness. “And that’s what makes the difference.”
When Exercise Is The Best Medicine, Forbes 2019.12.15
“Digital health writ large has also struggled with finding the balance between virtualization and high touch. One set of companies have focused on delivering efficient services to low cost, low complexity patients who don’t need more care or change the underlying cost in the system (think of direct to consumer health companies like Hims, Roman, and others). Another set has focused on high cost, high complexity patients (i.e. multiple chronic conditions needing a lot of treatment and management) but run more or less completely manual services.
Consider the class of new primary care and medical management companies: ChenMed, Iora Health and Landmark Health. These are some of the most interesting companies in health care, but ironically they’ve been successful by being more intensive and manual in their care workflows. Instead of progressing towards less manual service, we’re progressing towards more! I will give this whole class of companies credit for developing innovative care models that improve quality of care and costs, but it’s a step forward in one direction and backward in another.
Other companies going full stack (Virta Health, Omada, and so on) are also heavily manual. In my experience, the industry’s dirty little secret is that “tech enabled service” means “service where we built some software that hardly makes a difference.” They still have a person doing most of the talking directly to the patient. Almost every company in the space is guilty of this. And this is another form of rampant incrementalism. People haven’t charted a path to dramatically changing the underlying cost structure of care delivery. One of the key questions is how we make the service of care delivery a good that we can mass manufacture. This is a key idea to unlocking an equitable and efficient future economy: the “goodification of services.” We need to dramatically scale healthcare expertise, especially when it comes to complex patients who need more access. We need near-zero marginal cost medicine.”
Why digital health has been such a disappointment, and how to change that, CNBC 2019.12.15
2019.12.15
Excerpt – An aging population is fueling the rise of the robot caregiver, as the devices moving into the homes and hearts of the aging and sick offer new forms of friendship and aid. With the global 65-and-over population projected to more than double by 2050 and the ranks of working age people shrinking in many developed countries, care robots are increasingly seen as an antidote to the burden of longer, lonelier human lives.
[..] Issues of freedom and dignity are most urgently raised by robots that are built to befriend, advise and monitor seniors. This is Artificial Intelligence with wide, blinking eyes and a level of sociability that is both the source of its power to help and its greatest moral hazard. When do a robot assistant’s prompts to a senior to call a friend become coercion of the cognitively frail? Will Grandma’s robot pet inspire more family conversation or allow her kin to turn away from the demanding work of supporting someone who is ill or in pain?
“Robots, if they are used the right way and work well, can help people preserve their dignity,” says Matthias Scheutz, a roboticist who directs Tufts University’s Human-Robot Interaction Lab. “What I find morally dubious is to push the social aspect of these machines when it’s just a facade, a puppet. It’s deception technology.”
For that is where the ethical dilemmas begin — with our remarkable willingness to banter with a soulless algorithm, to return a steel and plastic wink. It is a well-proven finding in the science of robotics: add a bit of movement, language, and “smart” responses to a bundle of software and wires and humans see an intentionality and sentience that simply isn’t there. Such “agency” is designed to prime people to engage in an eerie seeming reciprocity of care.
[..] research suggests that many seniors, including trial users, draw a line at investing too much in the charade of robot companionship, fearing manipulation, surveillance, and most of all, a loss of human care. Some worry robot care would carry a stigma: the potential of being seen as “not worth human company,” said one participant in a study of potential users with mild cognitive impairments.
“If the only goal is to build really cool stuff that can increase speed and profit and efficiency, that won’t prioritize human flourishing,” says John C. Havens, executive director of a pioneering global initiative on ethical AI guidelines by the Institute of Electrical and Electronics Engineers.
A main principle of these and other leading guidelines is “transparency,” the idea that humans should know if they are dealing with an algorithm or robot and be able to understand its limits and capabilities. (Call it the anti-Turing test.) One recommendation to industry is for care robots to have a “why-did-you-do-that” button so users can demand an explanation of its actions, from promoting a product to calling the doctor.
Social robots also should carry a notice of potential side effects, the guidelines suggest, “such as interfering with the relationship dynamics between human partners,” a feature that could inspire caregivers to protect those most cognitively vulnerable to a robot’s charms. Such “soft-law” guidelines can help users, caregivers and designers alike better understand what they are dealing with and why, even as we continue to debate the questions of just how social, how humanlike and how transparent we want or need a care robot to be.
Would You Let a Robot Take Care of Your Mother?: As the global population ages, robot companions are on the rise, New York Times, 2019.12.13
Excerpt – California patients were more than five times more likely to have office visits for mental health or addiction problems from providers outside of their insurance plan’s network than patients seeking medical or surgical care, according to a new analysis by healthcare consultants Milliman Inc. Insurers here paid primary care providers 15 percent more than they paid behavioral health providers.
[..] The most recent failure: [California state senator Jim] Beall’s 2019 bill to ramp up requirements for health plans to report parity compliance data to state agencies each year instead of every three years, as it does now. The bill would have required the agencies to report results to the Legislature, and to post them on their websites to make them easily accessible to the public. Beall says that would help make the state less reliant on patient complaints to trigger enforcement.The bill also would have prohibited insurers from requiring prior authorization and “step therapy”— or making patients first try lower cost medications before receiving other prescriptions to treat substance abuse. [..]
[Los Angeles attorney and psychotherapist Meiram] Bendat and others do praise the work of the Department of Insurance, which covers a small fraction of the state’s health plans.
The Department of Managed Health Care said in an email that it “works diligently to ensure that health plans comply with state and federal requirements regarding mental health services.”
This includes surveying all licensed plans every three years, interviewing plan staff, reviewing enrollee files, and tracking complaints. In recent years, the department added two staff members and conducted focused comprehensive reviews of 25 health plans’ methodologies for providing mental health services. It then required those plans to eliminate impermissible day and visit limits, revise prior authorization requirements, and reimburse enrollees a total of more than $517,000. In the last decade, it has cited health plans dozens of times for mental health-related violations, resulting in more than $4 million dollars in fines— most levied against Kaiser in 2013.
The department says if patients feel they have been denied medically necessary treatment by their health plans, they can appeal to the state for an independent medical review. But critics say the vast majority of patients never appeal.
[..] Other states did pass parity-related bills last year, among them Colorado, Connecticut, Delaware, Illinois, New Jersey and Tennessee. A massive publicity effort featuring compelling personal stories, combined with negotiations, may be part of the equation — and part of what’s been missing in California. Often, health insurers dropped their opposition after intensive negotiations and media and education campaigns, said Tim Clement, director of legislative development at the American Psychiatric Association.
Clement, who was at the negotiating table in many of those states, but not California, called it “pretty close to impossible to get a bill passed if the insurance industry opposed.” He blamed California’s inaction partly on the lack of “a cohesive, boots-on-the-ground movement” for parity.
In Colorado — which just passed an expansive parity bill that will close loopholes, improve transparency and enforcement, and strengthen mental health prevention and screening — “we just were relentless,” said Lauren Snyder, state policy director with the advocacy organization Mental Health Colorado. That included working with media outlets to share personal stories of individuals harmed by a lack of mental health care, and ads urging people to contact their legislators.
[..] Dr. Richard Pan, a Sacramento pediatrician who chairs the Senate Health Committee, wants to give plans more incentives to serve people with serious mental illnesses.
“No one wants to be known as the health plan with the best mental health coverage or diabetes or asthma,” he said. His idea: a shared risk pool to reward plans that provide quality care for people with chronic conditions.
Californians aren’t getting the mental health care they’re legally guaranteed: Lawmakers want to know why the system of ‘parity’ is failing, The Mercury News, 2019.12.14
Excerpt – About a third of all infertility suffered by couples is attributed to male problems, a third to women, and a third is unexplained. Compared with women’s fertility, male fertility does not have the same age cliff, but studies show that it does slowly decline and that older men are slightly more likely to have babies born with disabilities. Overall, male fertility has dropped by more than half in 40 years, according to a large study of studies in 2017.
[..] Greg Sommer, founder of Sandstone Diagnostics, said that men on average have their first test after about 18 months of having difficulty conceiving, even though fertility testing for women is often far more intrusive.
“By then, women are already doing a lot on their reproductive health, with doctors’ visits and tracking,” he said.
Dr. Stanton Honig, a male fertility expert at the Yale School of Medicine, said he believes the at-home tests are valuable because they can be done at home and said papers have shown they are accurate. But he is less convinced that men who are not ill need to be freezing their sperm.
“I’m a little bit taken aback by companies saying, ‘Freeze your sperm because you are going to have a problem later,’” Honig said. “If a 50-year-old came to me and said he froze his sperm at 40, I’m not sure I’d recommend using the frozen sperm. I would tell him to try to get his wife pregnant the old-fashioned way.”
Sperm start-ups bet on declining male fertility, Los Angeles Times, 2019.12.14
Excerpt – A federal rule on digital health-sharing now under review “has good things to it but there are some bad things that have to be fixed, in my opinion,” [Epic founder Judy] Faulkner, 76, told NYU Langone Health CEO Robert Grossman at the Forbes Healthcare Summit in New York City on December 5.
“It’s a bit like Facebook in that—the friends of the users who gave permission to Cambridge Analytica to use the system—the friends’ data got pulled out with the users who had authorized Cambridge Analytica,” she said.
[..] Faulkner has previously commented that legislators may need to flesh out the rule further before it could be enacted. A vendor, for example, can believe it has taken sufficient measures toward due diligence yet needs guidance on its responsibilities and protections from bad actors if a problem does arise.
Her suggestion: delay putting the new ONC rule into effect “until Congress passes rules that whatever apps the data goes to have to treat it with HIPAA-type regulation,” she said, referring to the Health Insurance Portability and Accountability Act, which prevents disclosing sensitive health information without a patient’s consent or knowledge. “Right now studies have shown that most of the mobile health apps resell or share the data with others, and that’s dangerous.”
One study, released by the British peer-reviewed journal The BMJ in March, found “sharing of user data is routine, yet far from transparent” in 79% of top-rated medicines-related mobile apps. Sharing data with third parties, such as insurance providers and pharmaceutical makers, it noted, could impact healthcare premiums, employability, financial services or suitability for housing.
2019.12.2
Excerpt – “The science is exciting, the research is exciting,” said Ronald Bayer, a professor of socio-medical sciences at Columbia University’s Mailman School of Public Health in New York City. In part responding to Obama’s precision medicine push, he co-authored a 2015 perspective in the New England Journal of Medicine calling precision medicine “a distraction from the goal of producing a healthier population.”
For Bayer, precision medicine’s promise to peak into genetics and offer personalized treatments diverts attention from more foundational health concerns that could benefit far more people. “It’s very boring to say: ‘We have to take care of poverty,’ ” Bayer said.
[..] By getting more granular patient data, [director of the Scripps Translational Institute Dr. Eric] Topol believes providers could not only better manage diseases, but also work with patients at risk to prevent them from developing certain conditions. But “it’s still largely a research narrative,” Topol said of what he calls individualized medicine. That’s what researchers like Topol are working on now. “You need proof that you’re changing the outcomes for people, and that takes time,” he said.
Precision medicine, population health offer two sides to health improvement (2019.11.30)
2019.11.21
“One result was that the enacting law for Part D included several features limiting the financial risk to plans, particularly risks associated with high-cost beneficiaries. Key among these features is the federal reinsurance program: once a beneficiary reaches a “catastrophic limit” — corresponding today to about $8,000 in total drug spending — the federal government steps in to subsidize 80% of the remaining beneficiary spending for the year. The plan’s liability falls to just 15%, with patients responsible for the remaining 5%. The net effect is that the government, not the plan, bears most of the burden for those with the highest spending in the program.
In the early years of Part D, government reinsurance seemed reasonable. Less than 20% of total drug spending was for beneficiaries who had exceeded the catastrophic limit, and total federal reinsurance subsidies amounted to less than $10 billion per year. But the Part D standard benefit design has not kept up with the marketplace, particularly the emergence and growth of specialty drugs. Today, nearly half of total Part D spending is for beneficiaries who have exceeded the catastrophic limit, and reinsurance subsidies amount to around $43 billion, representing the largest component of federal spending on the program. As reinsurance spending grows disproportionately, plans bear less and less risk as a share of total spending. This situation calls into question what is being gained through the use of private plans.
In addition to the limited risk in catastrophic coverage, plans also bear very little liability for spending in the so-called coverage gap or “doughnut hole” phase. The ACA and the Bipartisan Budget Act of 2018 addressed the high and problematic cost sharing for beneficiaries by “filling in” this doughnut hole, so beneficiaries no longer face full cost sharing as they did in the early years of Part D. But these changes have relied primarily on contributions from drug manufacturers, rather than on adding to Part D plans’ liability.
Other Part D program features also limit plans’ ability to effectively manage spending. For example, plans use formularies with varied levels of beneficiary cost sharing as a tool to negotiate drug prices and encourage beneficiaries to use lower-cost options. But Part D plans’ ability to do so is limited by federal requirements that they cover all or nearly all drugs in six protected drug classes — which account for about 20% of all Part D spending — although plans can still use utilization-management tools for these drugs. Moreover, these financial incentives are ineffective for low-income beneficiaries (who account for about one third of enrollment and half of total drug spending), since the cost sharing that these patients would face is instead paid almost entirely by the federal government. Although these policies reflect important priorities related to access and affordability, they also undermine plans’ ability to effectively negotiate and manage spending.
The net result is that, today, Part D plans are actually responsible for only about 34% of total prescription-drug spending [figure below]. In contrast, according to data from the Health Care Cost Institute, health insurers in the commercial market paid an average of 85% of total drug costs in 2016.”

Distribution of Medicare Part D Spending by Benefit Phase and Payer. The graph shows the analysis of a 100% sample of 2016 Medicare Part D claims data, accessed through the Centers for Medicare and Medicaid Services Virtual Research Data Center. All spending for claims that “straddle” multiple phases is assigned to the final benefit phase of the claim. For beneficiaries who do not receive low-income subsidies (non-LIS), the distribution of payer liability in the coverage gap is adjusted to reflect 2019 limits (i.e., for branded drugs, liability is adjusted to 70% paid by manufacturers, 25% paid by beneficiaries, and 5% paid by plans; for generic drugs, liability is adjusted to 37% paid by beneficiaries and 63% paid by plans). The figure includes spending for both LIS and non-LIS beneficiaries. “True” out-of-pocket costs include manufacturer-paid discounts.
Who Pays in Medicare Part D? Giving Plans More Skin in the Game, NEJM 2019.11.20
“A limitation of existing alternative payment models is that most are directed toward primary care clinicians, even though specialists account for 95% of Medicare spending.
[..] radiation oncology physicians and clinics will receive a fixed payment for a 90-day episode of care. As the proposal notes, radiation oncology is well suited for episode-based payments because most courses of treatment are delivered in short, well-defined time periods. Participation in many previous alternative payment models has been voluntary and, as a result, low. For example, less than 10% of medical oncology practices participate in CMS’s Oncology Care Model.
[..] Episode payments will be based on average Medicare reimbursements for episodes at hospital-based radiotherapy clinics in 2015 to 2017. Payments will be risk-adjusted and differ by region. The model builds in automatic discounts of 4% (for professional fees) and 5% (for technical fees). These discounts represent CMS’ share of savings under the model. Participating practices will be 100% at risk for costs. If the payment exceeds their costs, the practices keep the difference. If costs exceed the payment, participants will not receive extra reimbursements.
[..] As in other alternative payment models, payments to participants will be partly based on patient satisfaction and quality. CMS will withhold 3% of episode payments, allowing practices to earn back some or all of the money based on their performance. CMS identified 4 quality measures: plan of care for pain, screening for depression and follow-up plan, advanced care plan, and treatment summary communication. [..] CMS was unable to identify any outcome measures relevant to radiation oncology.
[..] Use of proton beam therapy and IMRT [intensity-modulated radiation therapy] has increased in the absence of evidence that these modalities provide better outcomes compared with less costly 3-dimensional conformal radiotherapy. Many patients with breast cancer and patients with prostate cancer receive long courses of radiotherapy, even though some trials have suggested that short-course (hypofractionated) regimens are as effective. The episode-based payment model completely reverses the incentives for participants in the current system; participating centers and physician groups that treat patients using newer, more expensive modalities and long courses of therapy will lose money on a per-episode basis.
[..] As is the case with other episodic payment models, the Radiation Oncology Model is unlikely to have much effect on the decision of whether to initiate treatment. Older patients and patients with low-risk breast cancer and low-risk prostate cancer may safely forgo radiotherapy in some cases. However, by making participation mandatory and putting radiation oncology physician groups and clinics at full risk for costs, the Radiation Oncology Model could prove to be a much more powerful model for reshaping clinical practice and reducing costs than other, existing specialty-focused alternative payment models.”
Alternative Payment for Radiation Oncology, JAMA published 2019.10.9
2019.11.19
“A Medicare buy-in could be an attractive option for adults in the age-eligible range because buy-in premiums are lower than individual market premiums for most age groups. These lower premiums are driven by the assumption that the buy-in pays Medicare rates and has lower administrative costs than a private individual market plan, factors that outweigh the cost associated with creating an insurance risk pool composed entirely of older adults (ages 50 to 64 in most scenarios). Per beneficiary average costs in the current Medicare program—which covers an even older population and individuals with disabilities—were $13,665 in 2018 (Centers for Medicare and Medicaid Services, 2019), lower than the cost of a bare-bones marketplace plan for older adults in some states (Fehr et al., 2019). Our estimated premium for the buy-in plan is around $10,000 in most scenarios, a relatively good deal compared with the ACA-compliant individual market, in which older adults are charged up to three times as much as younger adults.
However, our analysis finds that enabling older adults to move to Medicare could affect premiums for people who remain in the individual market. We estimate individual market premiums would increase because of this change, rising by almost 9 percent in the base buy-in scenario. This finding runs counter to the conventional wisdom, which holds that older adults drive up individual market premiums. Our model accounts for the fact that low-cost older adults are more likely to enroll in insurance than low-cost young adults, and these healthy older people (who pay higher individual market premiums than younger people) act as a stabilizing force in the individual market. Removing older adults from the individual market leaves a pool of relatively expensive young people, leading to premium increases. This finding is for a national-level analysis, is based on a simulation model rather than insurers’ actual experience, and might not generalize to all states and rating areas. However, the Blue Cross Blue Shield Association found a similar result in an analysis of its internal data (Blue Cross Blue Shield Association, 2019).
We find that overall enrollment in insurance remains roughly constant across scenarios; slight gains among older adults are counteracted by slight declines among younger people. These findings suggest that a Medicare buy-in could offer significantly more-affordable coverage to older adults while potentially leading to higher premiums for the pool of people remaining in the individual market.”
Medicare for 50-to-64-Year-Olds: Assessing the Effects of Allowing Older Adults to Buy Into the Medicare Program, RAND Corporation (press release 2019.11.18)
Excerpt – “Currently, much of the conversation with providers focuses on the silos of risk adjustment scores and their level of participation in individual quality metrics. What is needed in the world of managing risk in population health is a single instrument that melds risk adjustment, adherence to accepted quality metrics, and clinical outcomes,” says Anthony Sorkin, MD, executive medical director of population health at Indianapolis-based IU Health.
To improve measurement of value, Sorkin and colleagues at IU Health have developed the Healthcare Economic Efficiency Ratio (HEERO), which features gauging actual spending on patient care against expected spending on patient care. HEERO is based on claims data for patients attributed to Medicare Advantage health plans or a Medicare accountable care organization.
The highlights of how HEERO works:
- Actual 12-month spend divided by expected 12-month spend equals Healthcare Economic Efficiency Ratio
- A ratio of more than 1.00 indicates spending at a higher than the expected level
- A ratio of less than 1.00 indicates spending at a lower than expected level
- The expected level of spending is based on a calculation using a modified Centers for Medicare & Medicaid Services Hierarchical Condition Categories risk score
[..] Although the HEERO program is in its infancy, the new metric has been well received by physician leaders and individual PCPs, Sorkin says. “HEERO allows us to get very granular with each physician, find those who are struggling, and pinpoint areas for improvement either in risk score coding accuracy or in spending behavior.”
Indiana Health System Develops New Measure of Care Value, HealthLeaders, 2019.11.18
“In response to growing bipartisan outrage over prescription drug prices, Sens. Cory Booker (D-N.J.), Bernie Sanders (I-Vt.) and Kamala Harris (D-Cal.) introduced a bill on Friday proposing the creation of a new federal agency: the Bureau of Prescription Drug Affordability and Access.
[..] Biotech companies invest billions of dollars and decades of research to produce lifesaving medications that generate high profits for 10 to 15 years until their patent protections expire and drugs become generic. It’s as if society has paid off the mortgage on a home. Competition brings down costs, often by 80% to 95% within a few years, and the generic drug becomes a cheap public resource from then on. It’s a virtuous cycle, but the process doesn’t always work as designed.
The biotechnology industry is now developing an increasing number of promising medications that cannot be genericized, such as gene therapies, CAR-T cells, and complex biologics. Drugs that cannot go generic violate the social contract that this industry shares with the American public because their costs will remain high indefinitely. It is essential that we plan ahead for how to deal with these products before they become battlegrounds for patients, payers, and industry.
[..] Contractual genericization [click here for a more detailed exploration of the concept] would require companies to lower drug prices to a reasonable margin above production cost if after a drug’s patents have expired — typically 10 to 15 years after FDA approval — the drug’s price has not been naturally reduced by competition.
[..] This bureau could also play a crucial watchdog role in the generics marketplace in three ways:
•protecting generic drug status by making samples of current drugs available to potential competitors for head-to-head studies;
•expediting extended patent challenges that delay the genericization of drugs with expiring protections;
•helping the FDA ensure the quality of all generics with random sample testing.
[..] Ideally, the same legislation that brings the bureau into existence would also cap or eliminate out-of-pocket costs for patients and make strides toward ensuring that everyone has insurance. Nothing about our health care system was ever meant to be affordable to patients out of pocket. To live up to its name, a Bureau of Prescription Drug Affordability and Access would also be expected to help patients access medications by policing insurance plans that fail to deliver on promised coverage either by denying access or imposing unaffordable out-of-pocket costs (some patients can’t access treatments that even their insurance plans agree are appropriate).
[..] we must not ignore the real driving force behind patient outrage: our system’s heartless use of high copayments and deductibles that make it difficult or impossible for some patients to receive treatment.
If America paid for water, sanitation, roads, and electricity the way it pays for drugs, tens of millions of Americans would be living in squalor. If that problem were as misdiagnosed as the problem of drug affordability, then America would blame all that suffering on the prices of water, electricity, and pavement instead of on the flawed ways those costs are spread across our society.
To fulfill the biotech social contract, we must ensure that drugs go generic in a timely fashion and then stay inexpensive so we can manage society’s overall health care spending. At the same time, we must make sure that individual patients can afford what their physicians prescribe. Only then will we progress toward a system that is equitable for all.”
Booker-Sanders-Harris drug affordability bureau could be brilliant, STAT 2019.11.18
2019.11.12
“Google began Project Nightingale in secret last year with St. Louis-based Ascension, a Catholic chain of 2,600 hospitals, doctors’ offices and other facilities, with the data sharing accelerating since summer, according to internal documents.
The data involved in the initiative encompasses lab results, doctor diagnoses and hospitalization records, among other categories, and amounts to a complete health history, including patient names and dates of birth.
Neither patients nor doctors have been notified. At least 150 Google employees already have access to much of the data on tens of millions of patients, according to a person familiar with the matter and the documents.
In a news release issued after The Wall Street Journal reported on Project Nightingale on Monday, the companies said the initiative is compliant with federal health law and includes robust protections for patient data.
Some Ascension employees have raised questions about the way the data is being collected and shared, both from a technological and ethical perspective, according to the people familiar with the project. But privacy experts said it appeared to be permissible under federal law. That law, the Health Insurance Portability and Accountability Act of 1996, generally allows hospitals to share data with business partners without telling patients, as long as the information is used “only to help the covered entity carry out its health care functions.”
[..] Google appears to be sharing information within Project Nightingale more broadly than in its other forays into health-care data. In September, Google announced a 10-year deal with the Mayo Clinic to store the hospital system’s genetic, medical and financial records. Mayo officials said at the time that any data used to develop new software would be stripped of any information that could identify individual patients before it is shared with the tech giant.
Google was founded with the goal of organizing the world’s information, and health has been a fascination of its top executives from the early days. Google Health, a fledgling effort to digitize existing medical records, was shut down in 2011 after three years of limited adoption. Alphabet has since poured millions of dollars into its under-the-radar Calico and Verily divisions, which aim to combat aging and manage disease, respectively.”
Google’s ‘Project Nightingale’ Gathers Personal Health Data on Millions of Americans
“Eligibility criteria included age 18 to 75 years, intentional weight loss of at least 5% in the previous 2 years, access to an Internet-connected computer, and receipt of care from a UPMC PCP. Exclusion criteria included a medical explanation for recent weight loss (for example, cancer), active preparation for bariatric surgery, bariatric surgery in the previous 5 years, or pregnancy.
[..] All participants received a 1-hour orientation on the EHR-based tracking tools (weight, diet, and physical activity tracking flow sheets) and basic information about healthy eating and safe physical activity. Participants were encouraged to log in daily and enter data on weight, diet, and physical activity. Those in the coaching group also received an introduction to the role of the coaches. Both groups received weekly reminders to enter information into the EHR-based tracking tools.
Participants in the coaching group received 2 years of personalized health coaching through the EHR patient portal. Three study coaches had backgrounds in nursing, nutrition, and exercise physiology. The other 2 received EHR training, and all received training on the study protocol. Participants were assigned to a specific coach, who contacted the participants via the EHR weekly for 1 month, biweekly in months 2 to 6, monthly in months 7 to 12, and quarterly in months 13 to 24, for a total of 24 scheduled contacts. Coaching group participants received brief questionnaires relevant to weight management, including a text field where they could discuss questions or barriers. On the basis of participant responses and self-monitoring data in the EHR flow sheets, coaches wrote a brief personalized note with advice on questionnaire topics and responses to any queries or barriers mentioned by the participant. Coaching participants who did not complete questionnaires or log information into the flow sheet for 2 weeks were considered inactive and were contacted by telephone or e-mail and invited to reengage at any time. Coaching participants were able to send secure messages to the coach. Tracking group participants received questionnaires related to general health promotion (for example, vaccines) each quarter but received no feedback on questionnaire responses or flow sheet entries.
[..] The primary outcome was weight change at 24 months.
[..] A total of 721 persons were screened by telephone. Of these, 527 were ineligible (n = 234) or declined to participate (n = 293). The remaining 194 completed baseline assessments and were randomly assigned, and 192 completed orientation sessions and began one of the interventions. Weight data at 24 months were available for 81% of participants (82% in the coaching group and 80% in the tracking group).
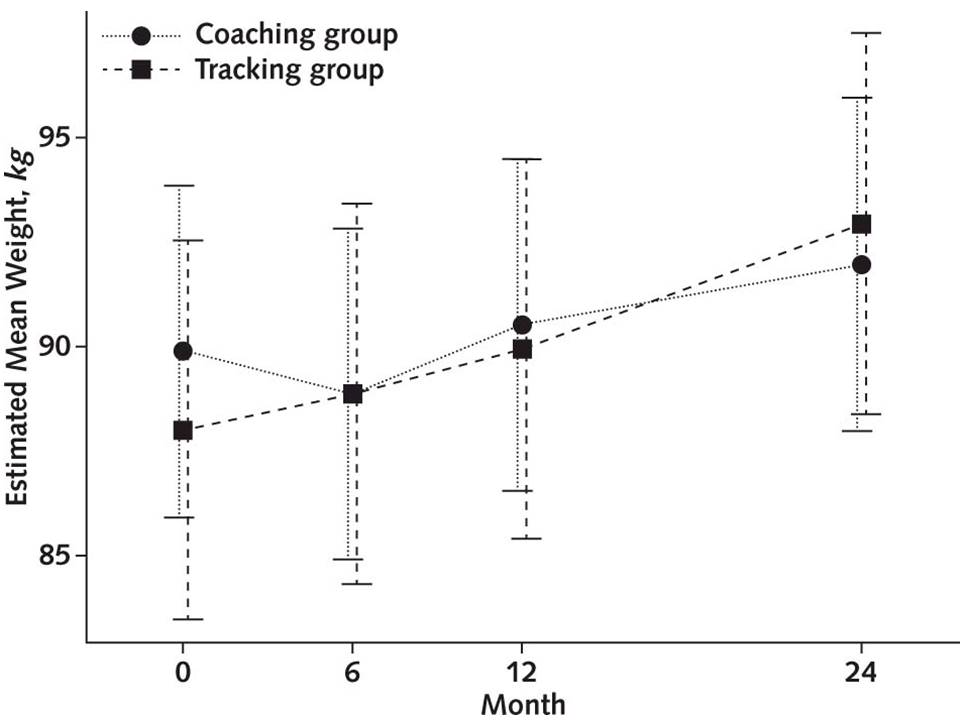
[..] Online coaching, particularly aspects related to encouragement and responsiveness to questions, has been valued by patients seeking weight management support in primary care settings. In this trial, the incremental addition of coaching and real-time progress reports to EHR-based tracking tools was more effective than EHR-based tracking tools alone in achieving desired weight outcomes at 24 months in a group of primary care patients with prior intentional weight loss. Changes in BMI and waist circumference were also more favorable in the coaching group. Our exploratory 30-month weight results suggest durability of effect after the intervention ended.”
Effect of Electronic Health Record–Based Coaching on Weight Maintenance: A Randomized Trial
2019.11.11
Excerpt – “This is the first demonstration that kidney cells can be implanted successfully in a large animal without immunosuppression and remain healthy enough to perform their function. This is a key milestone for us,” said Kidney Project co-lead Shuvo Roy, PhD, a faculty member in the Department of Bioengineering and Therapeutic Sciences, a joint department of the UCSF Schools of Pharmacy and Medicine. “Based on these results, we can now focus on scaling up the bioreactor and combining it with the blood filtration component of the artificial kidney.”
[..] The implantable device being developed by The Kidney Project consists of two components: an blood filtration system called the hemofilter, which removes toxins from the blood by passing it through silicon membranes fabricated with precisely shaped nanometer-scale pores; and a bioreactor, which contains cultured human kidney cells intended to perform other kidney functions, such as maintaining adequate fluid volume and blood pressure, adjusting salt levels, and producing essential hormones.
[..] The results, Roy says, demonstrate progress towards The Kidney Project’s hoped-for clinical “trifecta”: a heart-powered device that runs without batteries or other external connections that could introduce infection risk, and which can clean the blood without anti-rejection drugs or blood thinners.
The researchers now aim to scale up the prototype bioreactor to contain more cells in order to test whether the implanted device can supplement kidney function in animals with kidney failure, with the ultimate goal of eventually moving the device to human safety trials.
Implantable artificial kidney achieves preclinical milestone
“Social networks can consist of close friends, family members, and neighbors as well as peripheral others. Studies of social networks and associations with well-being have mostly focused on age-restricted samples of older adults or specific geographic areas, thus limiting their generalizability. We analyzed 2 online surveys conducted with RAND’s American Life Panel, a national adult life span sample recruited through multiple probability-based approaches. In Survey 1, 496 participants assessed the sizes of their social networks, including the number of close friends, family members, neighbors, and peripheral others. Of those, 287 rated their social satisfaction and well-being on Survey 2. Older participants reported smaller social networks, largely because of reporting fewer peripheral others. Yet older age was associated with better well-being. Although the reported number of close friends was unrelated to age, it was the main driver of well-being across the life span—even after accounting for the number of family members, neighbors, and peripheral others. However, well-being was more strongly related to social satisfaction than to the reported number of close friends—suggesting that it is the perception of relationship quality rather than the perception of relationship quantity that is relevant to reporting better well-being. We discuss implications for social network interventions that aim to promote well-being.”
Age differences in reported social networks and well-being
Excerpt – Another big challenge is the widespread shift of care out of the hospital. Protecting patients from errors in settings such as physicians’ offices, ambulatory surgery centers, diagnostic facilities, skilled-nursing facilities, and home health is harder because the safety infrastructure is much less developed than in hospitals.
Plus, the most common errors in those settings, such as diagnostic mistakes and failure to provide recommended preventive care, may be harder to detect and prevent than hospital-based harms.
“We don’t have an easy solution yet to extending this work into the clinics of private-practice pediatricians and helping them understand the factors influencing safety,” said Marcy Doderer, CEO of Arkansas Children’s in Little Rock, which has implemented a comprehensive safety program.
UCSF’s Wachter said that while much work remains to be done, he sees substantial improvement, especially compared with the chaos and egregious errors he saw 20 years ago.
[..] when patients get care from multiple specialists or health systems, “it seems like the right hand doesn’t know what the left hand is doing. We haven’t nailed that problem at all.”
Hospitals fall short of patient safety goals 20 years after ‘To Err is Human’
“The U.S spends almost 1% of GDP on Intensive Care Units (ICU). Given this statistic and comparatively lower spending with similar outcomes in other countries, the ICU should be an area where substantial cost savings can be easily achieved. Closer analysis challenges this assumption for several reasons including the inability to reliably determine which patients will survive, and the large — up to 80% in some models — apparently fixed costs of ICU care. These analyses, however, have focused almost exclusively on routine ICU care and not on the care for rare or expensive therapies for which it is not known whether substantial cost reductions can be achieved. We sought to apply a value (outcomes and cost) analysis to extracorporeal life support (ECLS), a relatively rare but very expensive ICU therapy with highly variable outcomes. To address the outcome component of the value approach, we created guidelines for ECLS delivery, and to address the cost component we explored opportunities for more efficient care.
[..] ECLS is often used in time-pressured situations that preclude robust evaluation of its appropriateness, especially in the absence of accepted guidelines. Currently available scoring systems provide only limited guidance on which patients will benefit from ECLS, and they do not account for quality-of-life considerations. Even in specific cases, Cedars Sinai clinicians often did not agree about the potential benefits of ECLS . The opinion of the surgeon who implanted ECLS devices tended to prevail, despite concerns voiced by other specialists, such as cardiologists or intensivists for a patient in cardiogenic shock, or the pulmonary and critical care intensivists for a patient with acute respiratory distress syndrome.
[..] Guideline development: Hospital leadership created an interdisciplinary task force to develop guidelines for patients and their families when ECLS was the only medical option. The task force focused on Extra Corporeal Membrane Oxygenation (ECMO), used for severe cardiac and/or respiratory failure. The task force drew upon information from the Extracorporeal Life Support Organization, peer reviewed literature on ECMO outcomes, and opinions from experienced clinicians. It eventually decided that during the first three weeks of ECMO, the therapy should be stopped if four or more organ systems failed, and, after three weeks, if three or more organ systems failed, though the task force included a process by which a patient could be exempted from these criteria.
In developing the guidelines for starting ECLS, the task force placed its emphasis on whether the provision of ECLS was consistent with a patient’s minimally acceptable outcome, maximally acceptable burden, and relative likelihood of achieving either. For example, a patient who stated a minimally acceptable outcome of rigorous physical activity and functional independence, but who would require an amputation for limb ischemia and a total artificial heart after separation from ECLS, would not be considered to have goals consistent with either ECLS initiation or, if already initiated, ongoing provision of ECLS. Based on this determination, treatment would not be considered appropriate at our institution. Alternatively, a similar patient who stated a minimally acceptable outcome to interact with children and grandchildren, regardless of how much assistance she needed, would be considered to have goals consistent with initiating and continuing ECLS.”
“In 1992, Barbara Starfield described primary care as consisting of the four Cs: first Contact, Coordination, Comprehensiveness, and Continuity.
Medical homes and accountable care organizations have chosen to focus the majority of their energy and resources into building concrete versions of the first three of these concepts. First Contact became access, Coordination became care management, and Comprehensives became population management.
It is my hypothesis that the patient-centered medical home (PCMH) / accountable care organization (ACO) movement committed resources to access, care management, and population health but took continuity — the trusting relationship — for granted.

[..] Studies do not yet exist and are likely too complex to undertake, but four insights in the literature are instructive:
- An analysis of the Medicare Coordinated Care Demonstration Programs showed that a key differentiator between successful and unsuccessful programs was whether the nurse care coordinator had frequent in-person meetings with the patient, and occasional in-person meetings with the PCP.
- Retail clinics, by design, are a natural experiment in separating accessibility from comprehensiveness, coordination, and continuity. The best study of these practices suggests that all they do is increase utilization and spending.
- A significant body of evidence shows that continuity of care is associated with greater patient satisfaction, improved health promotion, increased adherence to medication, reduced hospital use, and lower mortality rates.
- A recent study by D.M. Levine, et al., demonstrated that patients who reported experiencing all four Cs of primary care received significantly more high-value care and a better health care experience overall.
[..] Evidence suggests that trust naturally develops after years of “thoroughly evaluating problems, understanding a patient’s individual experience, compassion, empathy, advocacy, reliability and dependability, communicating clearly and completely, continuity of care, building a partnership, giving time in the consultation, providing appropriate and effective treatment, and being honest and respectful to the patient.”
I would argue that trusting relationships are foundational to the four Cs. Having exceptional information technology does little to impact outcomes if the patient doesn’t trust us enough to respond to a population health outreach. There is no point in being accessible if the patient feels bad about bothering us when they feel sick. And how can we expect patients to make lifestyle changes if we don’t know them as an individual and can frame the change in way that matters to them.”
Pay for Relationship: A Novel Solution to the Primary Care Crisis
2019.11.2
“Aware of the high prevalence of traumatic experiences including interpersonal violence (IPV) in the safety-net setting and the devastating impact of IPV on mental and physical health, a team at the University of California, San Francisco (UCSF), implemented a multi-sector partnership program called ARISE (Aspire to Realize Improved Safety and Equity) to improve the health and safety of adults and children affected by IPV. Through ARISE, we launched an IPV program by successfully aligning our program goals with the primary care–behavioral health integration goals of the San Francisco Health Network (SFHN), the public health care delivery system in San Francisco. Our collaboration resulted in a key innovation, called the “Behavioral Health Vital Signs,” which catalyzed trauma-informed quality improvement efforts in primary care to address IPV in conjunction with depression and alcohol and substance use.
Interpersonal violence (IPV), which includes but is not limited to violence occurring between individuals in intimate relationships, can occur across the lifespan, is highly prevalent, and often leads to devastating impacts on health. Often, mental health and substance use disorders are consequences of experiencing violence across the lifespan and, therefore, co-occur and are inter-related with IPV in myriad and complex ways. IPV is inadequately addressed in most health care settings, often a result of a failure to implement a systems approach.
In parallel, large percentages of people suffering from mental health and substance use disorders in the United States are under-diagnosed and inadequately treated. Furthermore, the complex inter-relationship between IPV and co-occurring mental health or substance use disorders is often not identified. Each of these inter-related conditions can have direct adverse health effects, undermine patients’ abilities to manage other chronic health conditions, increase overall health care utilization and costs, and lead to increased morbidity and mortality.
[..] In collaboration, SFHN and ARISE developed the BHVS screener, a six-question patient questionnaire for depressive symptoms, alcohol and substance use, and IPV, thereby streamlining primary care behavioral health initiatives into a single workflow using an integrated approach.

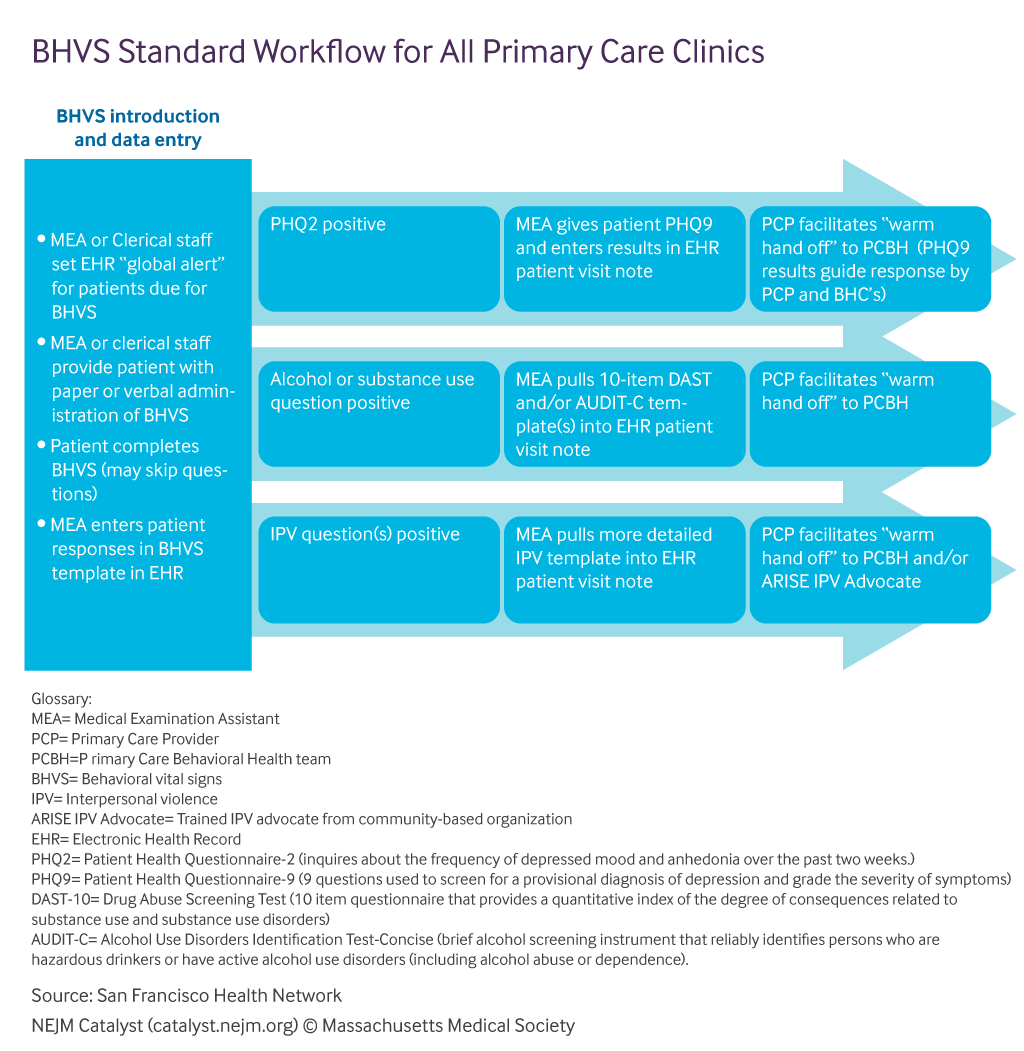
PCBH [primary care behavioral health] clinicians offer a series of six treatment sessions (with an option to extend if needed), utilizing motivational interviewing techniques and cognitive behavioral therapeutic interventions, to patients likely to benefit from a short-term treatment model. The PCBH teams also facilitate referrals to community-based specialty mental health and to community-based substance use disorders support services and treatment for patients who require more intensive treatment models. The PCBH teams follow such patients closely to help them overcome obstacles and stigma in engaging in more intensive care. When patients do not engage with the PCBH clinicians, primary care providers can consult with onsite PCBH clinicians (and the ARISE IPV Advocate and consulting psychiatrists) for assessment and management advice.
[..] Patients may dislike tools like BHVS or not recognize or want to discuss the interconnectedness of behavioral conditions with their symptoms and concerns. Patient advisors expressed preference for screening tools that include items regarding positive coping behaviors and resilience factors [..].
[..] Without robust behavioral health resources or effective care models for follow up, health care providers understandably can have mixed feelings about BHVS screening. Additionally, patients may express reluctance to engage with PCBH due to stigma and other concerns, even if those services are available.”
The “Behavioral Health Vital Signs” Initiative
“The Challenge: To ensure that we were effectively implementing OpenNotes in a way that supported our diverse population, we needed a rigorous system for measuring performance. However, we found that metrics used in the literature and by most health systems to evaluate OpenNotes performance were inadequate for informing targeted actions.
Data cascades display the cumulative effect of consecutively introduced steps in an intervention. By breaking down a process into its components, we could readily identify potential root causes by studying various drop-off points in clinical note activity. Based on our review of the literature, other organizations implementing OpenNotes did not measure their performance to the level of specificity seen in our data cascades.
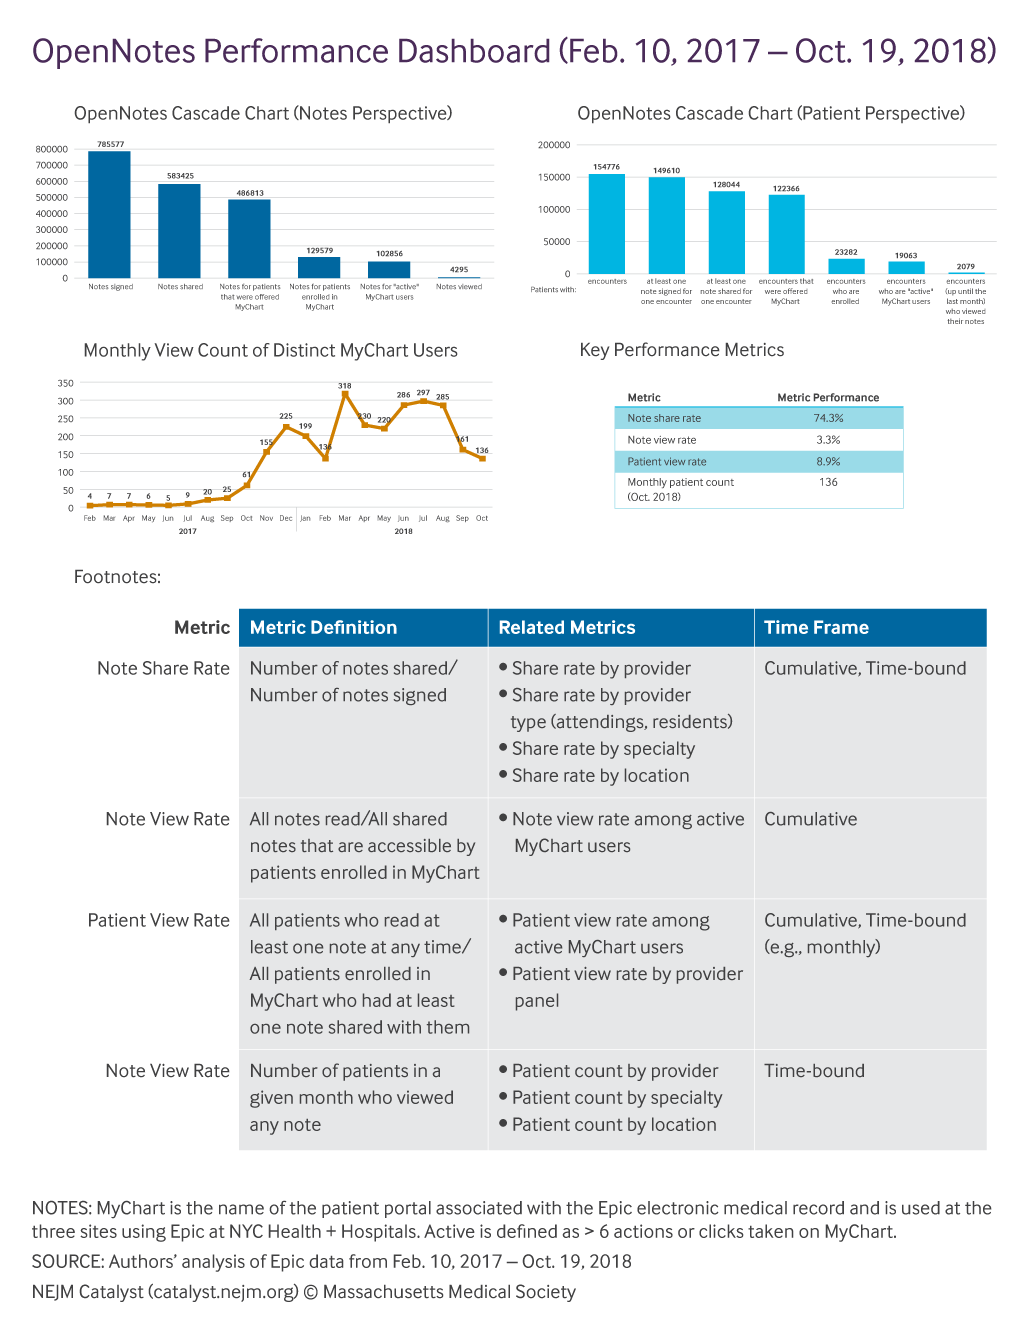
[..] Even after removing those technical barriers, we saw that many patients still were not viewing their clinical notes. We knew influencing patient behavior would not be a simple technical fix, so we turned to behavioral economics principles. We partnered with the global Behavioural Insights Team to design interventions and enhance user experience using their EAST framework, which involves applying Easy, Attractive, Social, and Timely (EAST) measures to influence behavior change.
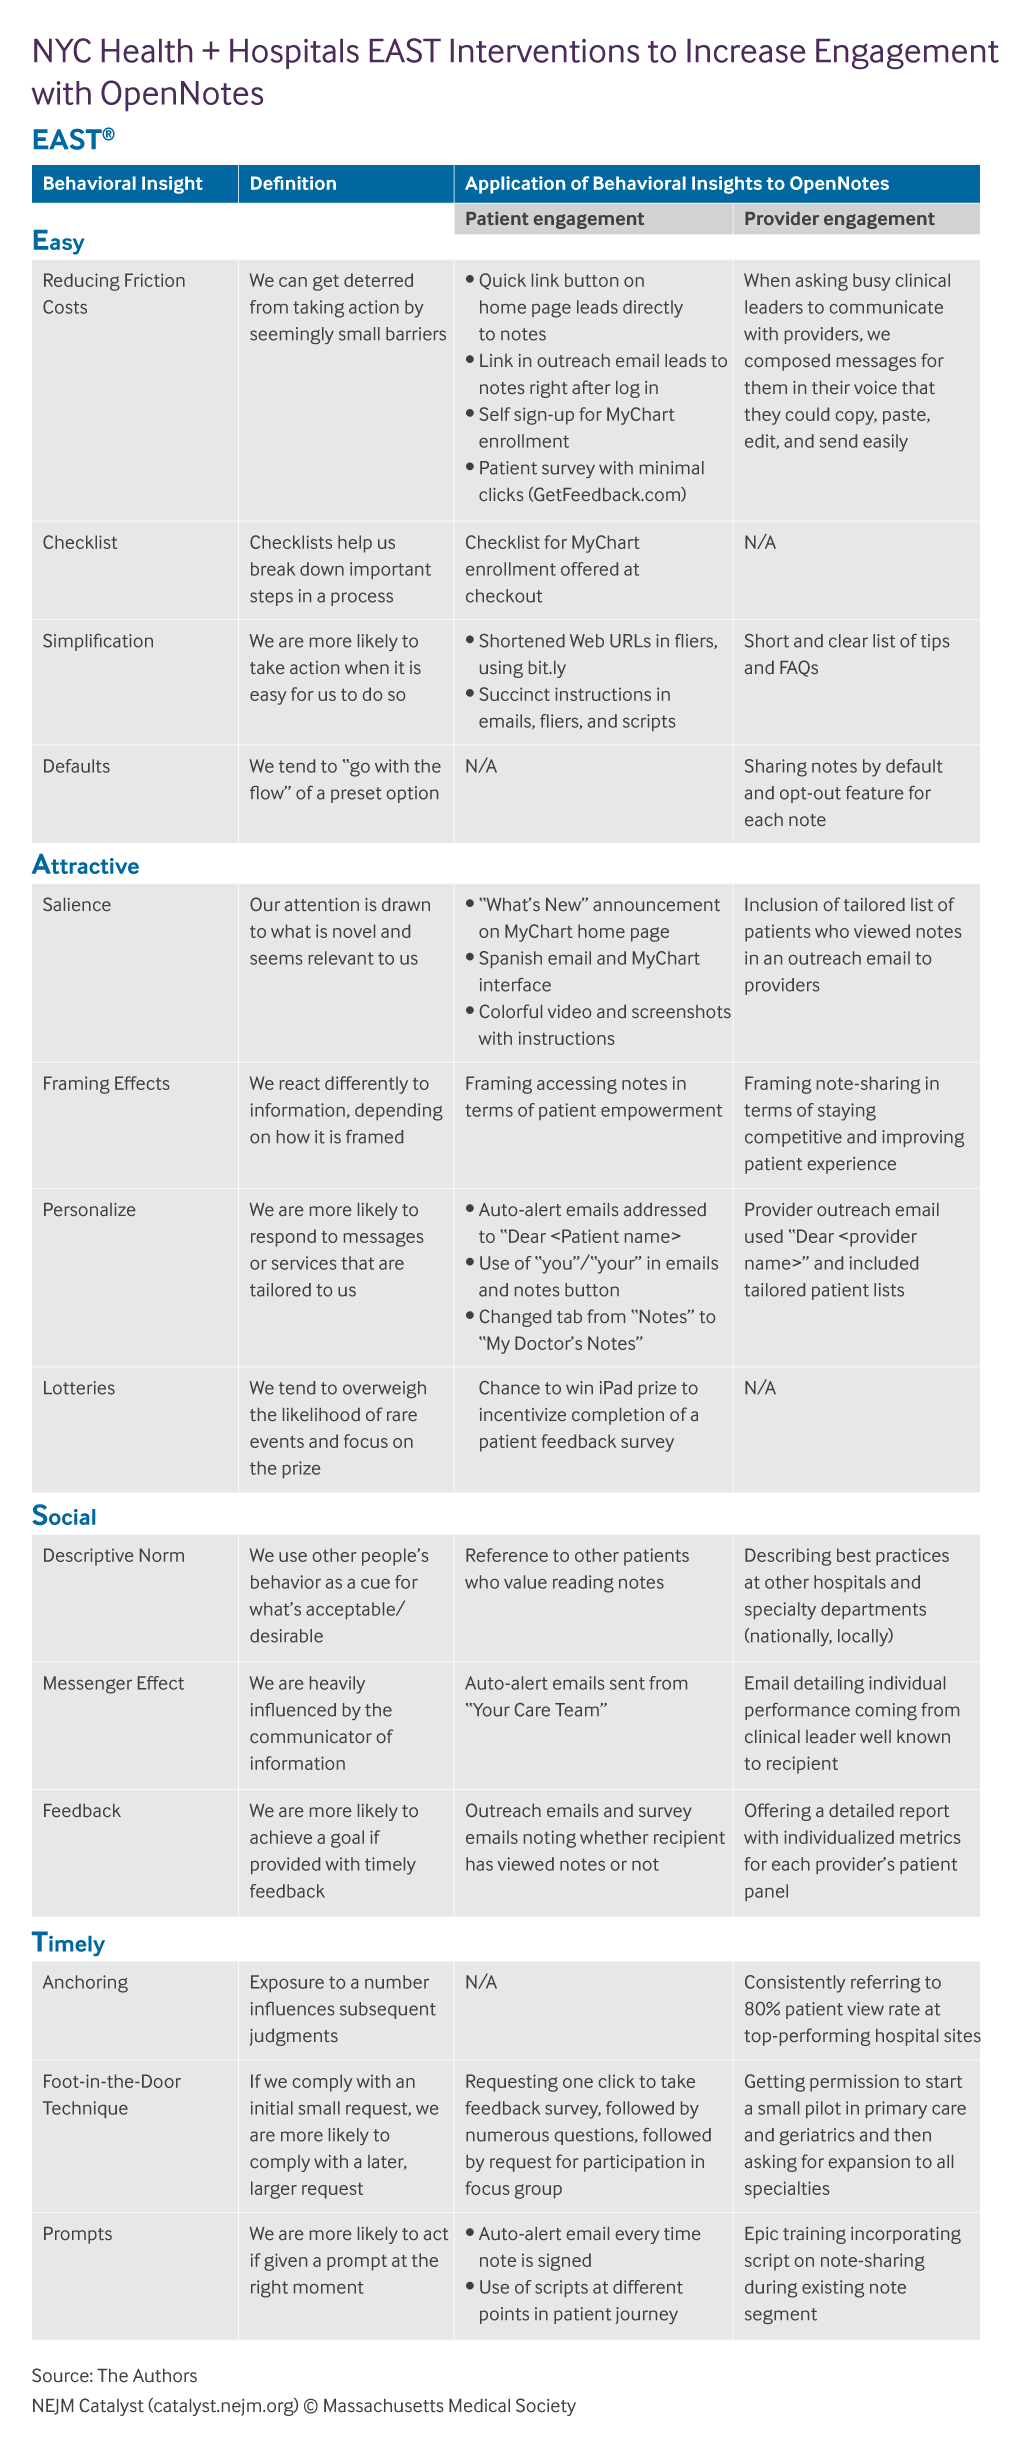
[..] Data cascades and their related metrics allowed us to quantify our performance at each step of implementation and engage appropriate stakeholders to address any challenges. Our performance dashboard clearly communicated our progress across clinical teams and encouraged an iterative approach to problem solving. In addition, data cascades helped us design targeted interventions to achieve specific outcomes.
As we consider what success means in OpenNotes implementation, we must also use both quantitative and qualitative data to understand and improve patient engagement. Just because patients view their post-encounter note does not always mean they understand it or derive any benefit.
Finally, as health systems consider how to implement patient-engagement initiatives, it is critical to assemble interdisciplinary teams with the right mix of skill sets, including some not included in traditional hospital administration and population health management. In our case, data science skills were important for mining data, creating compelling graphs, developing our randomized control trials methodology, and evaluating their impact. We also partnered with marketing and communications teams for patient outreach. Our training teams helped engage and educate our providers. Our technical teams and behavioral science partner refined the patient and clinician user experience. All these different skill sets were united through our Office of Population Health, which often works across disciplines and care settings in crafting new care models and enabling patient engagement.”
Measuring Performance of OpenNotes Initiatives to Target Improvement Efforts
2019.11.1
Excerpt – When our leaders talk about healthcare cost, they focus on drug companies and health insurance. Drug companies deserve the spotlight: they have raised prices aggressively (sometimes egregiously) and produced prominent bad actors like Purdue Pharma. But drug spending is 15% of U.S healthcare spending. It’s about 2x peer countries’ per capita spend, largely due to higher prices. We need to cut overall spending by 50% to match the efficiency of our peers. Cutting drug spend in half would deliver a 7% savings.
[..] What about the insurance companies? Their added costs and profit are about 7% of U.S. healthcare spend (most of their revenue passes through to providers). A single payer system like Medicare does the job for 2%, so overspend due to our complex insurance system is about 5% of healthcare over spend. In addition the insurance system drives providers‘ cost with its complex billing procedures, but it is also the major force in the healthcare economy that pushes down provider prices. Bottom line: 5% is a small part of the problem.
[..] The answer lies with the providers: doctors, hospitals, and other healthcare professional services. Their charges are 69% of U.S. healthcare spending: it’s hard to address healthcare costs seriously without addressing provider costs. Provider prices in the U.S. are much higher than in peer countries: hospital charges are about 200% of peers, and doctor charges are about 300% of peers.
[..] These high prices are offset by some “efficiencies”: Americans have 38% fewer doctor visits per capita than the OECD median and 23% fewer hospital beds available4. This could be seen as efficiency or less care; it’s definitely less care for the ~20% of Americans who are un- or underinsured and can’t afford to see a doctor.
The other significant difference is what economists call “wealth effect”. Average income is higher in the U.S. than the peer countries. Wealthier countries inherently spend a higher percentage of national income on healthcare. Wealth effect accounts for most of the remainder of the U.S. overspend. The other factors, including litigation costs, are small in total. The “stair-step” chart below adds up the main factors that bring U.S. healthcare spending to twice the level of peers.
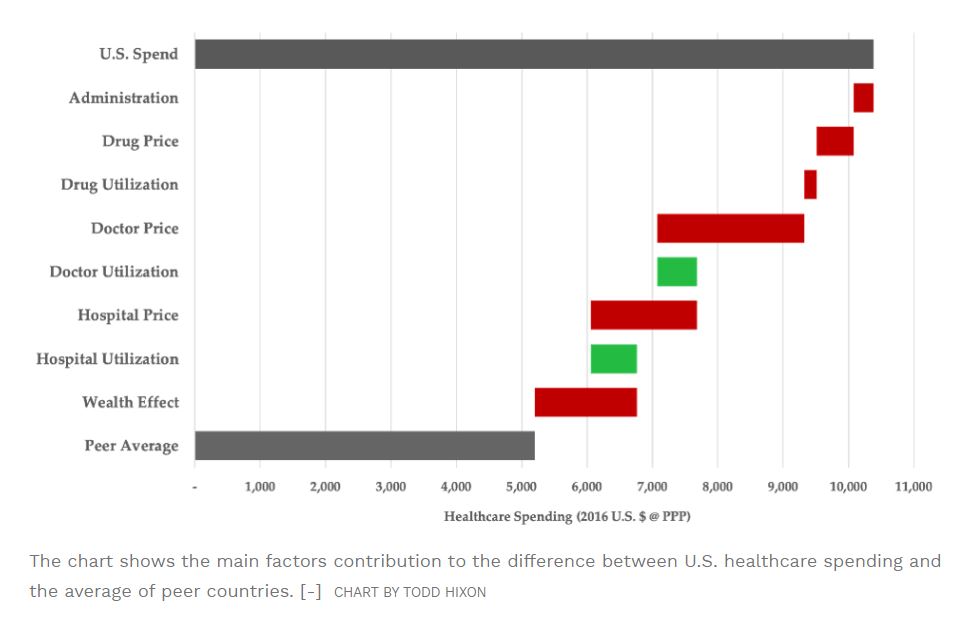
Ignore The Political Talk; Our Main Healthcare Challenge Is Provider Cost
“Lower- and middle-income Georgians currently receive about $2.7 billion in subsidies from the ACA exchange market, Kemp aides said. Under their plan, Georgia would take control of that money, change how to distribute it, and loosen controls on who gets it.Right now, only a plan that complies with the ACA’s coverage mandates is eligible for federal premium subsidies. Kemp’s plan would allow subsidies for plans that cover less.Pre-existing conditions would have to be covered, aides said, and plans couldn’t charge more for customers who suffer from them. But the plans wouldn’t have to cover all “essential health benefits” identified in the ACA — such as emergency care and mental health services — if the customer decides to risk it and buy a plan without them.
[..] Right now those skimpier plans are not available on the federal exchange website, healthcare.gov. Under Kemp’s plan, Georgians who tried to access that site would be routed to a page that gave them options including private web brokers that can list plans that cover less.
[..] “Some of these plans that don’t offer full essential health benefits, their marketing is very confusing,” said Laura Colbert, the director of Georgians for a Healthy Future. “I would worry a lot that consumers would buy a plan that doesn’t actually work for them.” If approved by the federal government, the plans would require a tremendous amount of work that is currently done at the federal level, necessitating an expansion of a health oversight agency in Kemp’s office. Aides said that detailed questions about implementation, however, were premature.”
Kemp unveils proposals to overhaul Georgia individual health plans
“As states are advancing regional collaboration to improve high-risk maternity care, a growing number also are focusing on efforts to align local and national quality improvement strategies with evidence-based practices. For example, Texas has joined the Alliance for Innovation on Maternal Health (AIM), established in 2014 as a pilot and now operating in 20 states across the country. AIM is a national partnership funded by the Health Resources and Services Administration’s Maternal and Child Health Bureau. The alliance includes provider, public health, and consumer groups working at the state level to provide technical assistance, individualized coaching, and peer-to-peer mentoring opportunities to hospitals and other providers for implementing evidence-based protocols—called “maternal safety bundles.” These bundles provide resources to help hospitals and care teams reduce preventable deaths and near-deaths from childbirth complications. Bundle topics include, but are not limited to, maternal depression and anxiety, opioid use disorder, postpartum basics, severe hypertension, and obstetric hemorrhage.
TexasAIM is training local service providers—including nurse managers, physicians, social workers, and others participating on patient care teams—to implement safety bundles for treatment of obstetric hemorrhage, opioid use disorder, and severe hypertension in pregnancy. While results are not yet available in Texas, the ACOG reports that four AIM states that implemented the hemorrhage and hypertension bundles in 2015 had reductions in maternal morbidity ranging from 8.3 percent to 22.1 percent, bringing the average overall rate of severe maternal morbidity in those states to less than 2 percent.
[..] Imagine a country where maternal care is highly coordinated across a care region. Instead of putting resources toward a small volume of specialty OB services, small rural providers focus on low-risk deliveries, while care for high-risk patients and emergencies is delivered at hospitals with specialized staff and capabilities. Data collection on maternal outcomes and quality improvement efforts are timely, coordinated, and shared across regions. Resources are allocated to ensure that all patients have unbiased, evidence-based care, when and where they need it. The health system experiences a reduction in maternal mortality and morbidity that is the envy of the developed world. That goal can become a reality in states that seek and advance innovative solutions.”
To Save New Mothers, We Need To Rethink Care Delivery
“By 1998, Vincent Serravallo, writing in the journal Race, Gender & Class, observed that just five professions represented an outsize number of participants: attorneys, physicians, engineers, managers, and educators. At this time, men still outnumbered women almost two to one. Serravallo breaks down the various ways in which marathon training and racing are expensive: the time required to log adequate miles in physical preparation, the additional cost of nutrient-dense healthy food preferred by many runners, and the gear (including the now humorously outdated “lyrca pants”) that many runners purchase. Serravallo’s breakdown includes late-90s prices (the cost of registering for the New York marathon alone has gone from $70 in 1998 to $255 in 2019, increasing at 2.5 times the inflation price), and it’s now common to see runners in, as mentioned, top-of-the-line GPS watches and lightweight carbon-plated shoes initially designed for professional athletes. The shoes often retail for $250.
Seravallo’s argument is that the limitations and positive reinforcement of class explain the disproportionate representation of wealthy marathon participants. For example, Seravallo points out that high-income earners are more likely to “enjoy the advantage of cleaner, safer, and more pleasant running provided by the residences their higher incomes can bring.” They have the kinds of higher positions within their jobs that allow for some flexibility (running at lunch time, or coming in early and logging more hours at home after a key long training run, for example), and the disposable income to buy the items and services he deems essential to appropriate training (clothing, shoes, access to a physical therapist for preventative care, or to a gym for strength training), and class culture. Seravallo is referring to class culture both in and outside of professional life, but there is doubtless significant overlap. A person who works with others who run recreationally or train for marathons is also more likely to encounter other runners and support for runners in their personal life. This notion of class culture gets at the dismantling of the working class running archetype and touches on the narrative of marathon running as a metaphor for personal improvement that Cooper attributes to Lebow’s leadership.
[..] Cooper argues that “women runners may have been the first to present the possibilities of the marathon as a profit-making experience.” The first women’s only race (a10-kilometer race in Central Park that’s still held today) that New York Road Runners hosted was the brainchild of a public relations firm. The model of sponsorship and marketing targeted at runners with disposable income that the marathon would ultimately adopt was rolled out at that inaugural women’s race. In 1978, the marathon distributed commemorative race t-shirts, which functioned as motivation, bragging rights, and of course, advertising for the race’s sponsors. Although it’s common now to see race t-shirts covered with multiple corporate logos, the Perrier emblem on the white and green ringer-t’s left sleeve was groundbreaking.
[..] Cooper points out that “the association of running with such values as health, fitness, and feminism made marathoning attractive to upper-status individuals.” In this way, what happened with the New York City Marathon in the years after its inception seems a precursor to today’s behemoth wellness culture, or more generally, to the idea that self-improvement is synonymous with leading a meaningful life.”
2019.10.31
Excerpt – Galileo is still in the early stages of development. Customers can buy the basic package for $60 a year, which gives patients basic care, prescription renewals, and collecting and digitizing health records. For a $140 annual fee, patients can also get lab testing, expert referrals, and medical consultations, all online. The goal is to have Galileo treat urban and rural populations, serving people on government funded and private insurance across the US, Lee said on the podcast. Lee said that Galileo is going a step further than One Medical by doing more tech-enabled care via its app and treating more people by taking on Medicare Advantage and Medicaid recipients in addition to people with private insurance. [..] “We want a more dramatic impact for a broader population,” he said.
When Lee started One Medical, he knew investors wouldn’t fund the idea just because it was trying to change a significant process in the healthcare system. He had already done work with the healthtech startup Epocrates, which made investors more willing to trust Lee’s vision, he said. [..] The subscription system was also helpful because it gave One Medical instant feedback on how much customers valued the service, Lee said. “Consumers engaged with the purchase choice,” he said. “We got feedback from the market directly, and they valued it enough to pay a premium.” While Lee has big ideas for healthcare, he considers himself a pragmatist and wants the results of his healthcare ventures to speak for themselves, he said. “We’re in a hype cycle world,” Lee said. “We’ve been in a hype cycle world for the last 20 years in healthcare and how much impact have we actually had? I like to build things that are more substantial, durable and that takes time.”
“• [..] those in the individual market who did not qualify for subsidies (40% of that population)––and even many who did qualify for premium subsidies but still faced enormous deductibles (those making more than 250% of the federal poverty level), the choices were often unaffordable. What good is a premium of a few hundred dollars a month for a subsidy eligible family making $65,000 a year only to have to face a $7,000 per person deductible?
• Given the unattractiveness of the Obamacare individual market policies, we never had more than 40% of the subsidy eligible sign-up for coverage (75% are needed for a balanced and efficient risk pool) leading to a very expensive policy premiums and a cycle of ever higher premiums driving out even more of the unsubsidized who could no longer afford the premiums and deductibles––family plans costing $15,000 to $20,000 a year with $7,000 individual deductibles were not uncommon.
• Insurance companies responded by dramatically raising the rates leaving them with only the most highly subsidized consumers insulated from these high premiums and deductibles by the federal subsidies (largely those making less than 250% of the federal poverty level). Simply, these highly subsidized people don’t care what the policies cost since their costs are capped at a percentage of their income enabling insurers to charge premiums high enough to cover the cost of the very sick risk pool and still create record profits for themselves. The health insurance industry will pay out $800 million in consumer rebates this year because they exceeded maximum profit limits under the law.
• The Medicaid expansion has also been good news for the insurance industry—two thirds of Medicaid beneficiaries (54 million people) are now enrolled in private Medicaid contracts with $300 billion in Medicaid money paid through health insurers. That is up from $60 billion ten years ago.
• Simply, we went from a pre-Obamacare system that hurt the poor and the sick to a post-Obamacare system that works well for the poor and sick but has made things much worse for the middle-class—but is very very profitable for the insurance industry.
These trends have manifested themselves in the data. According to an August CMS report:
• During two successive years of declining unsubsidized individual market enrollment from 2016 to 2018 (beginning before the Trump administration), enrollment declined by 2.5 million people—representing a 40% drop in unsubsidized consumers in the individual health insurance market. By itself, Iowa lost 91% of its unsubsidized market.
• The most recent year (2017 to 2018) showed a drop of 7% of those covered in both the subsidized and unsubsidized individual health insurance market—with a drop of 4% in the subsidized market and a 24% drop in the unsubsidized market.”
Obamacare Is “Stable” At An Incredibly Unstable Place
“I fully understand action is needed to reduce the rising costs of medication. But like price controls of the 1970s, does this bill really address the problem of the high cost of healthcare which has risen steadily for decades at a rate faster than inflation?
No.
Congress would do far better to address healthcare costs comprehensively rather than piecemeal. Annual healthcare costs in the US tops $3 trillion. Improving health, early detection, and early treatment saves money. Early treatment of diabetes, for example, increases annual spending for insulin and medications, but also saves an estimated $6,400 in hospital costs per patient per year.
Chronic illness care costs double when there is a dual diagnosis of depression. Integrated care models that treat behavior and physical health together decrease costs and improves outcomes.
States with redistribution programs for unused prescription drugs realize a cost savings, however nearly half of those states which passed laws still do not have functioning or operational programs. If unused drugs were safely distributed, the annual saving in California alone exceeds $700 million. Another study found the annual costs per patient of wasted medication exceeded $1,300.
[..] The best cost savings in drugs, are the drugs never prescribed. Unnecessary prescribing costs top $200 billion per year. One third of antibiotics prescribed are unnecessary according to the CDC. Many patients still receive prescriptions for medications, followed by drugs to treat the drug side effects and drugs to treat the side effect drug’s side effects. It is maddening.
Changes in care and prescribing practices saves more money and improves the quality of care than the current bill before Congress. If lawmakers really want to lower the costs of prescription drugs, I suggest they go back to the drawing board, work in a bipartisan manner and fix the problem, not the price.”
Forced Drug Prices Are Not The Answer To Health Care Costs
“FindTreatment.gov modernizes an obscure directory of 13,000 licensed treatment providers maintained by the Substance Abuse and Mental Health Services Administration, adding user-friendly search criteria and tools. For instance, it will now allow users to search based on the type of treatment sought — such as inpatient, detox or telemedicine — by payment option and whether the treatment is medication-assisted.
The website was built in-house by government coders and is managed by the White House. The administration is calling FindTreatment.gov an example of “American-First design” that offers easy access to information without breaking the federal budget.
[..] The site’s design was informed by more than 300 user feedback responses and 60 detailed interviews with those who have sought treatment, their family members and providers, the White House said.”
White House launches website aimed at addiction treatment
“a concept that Gartner talks about regarding the “two levels of digital maturity for consumer-centric healthcare… Level 1 maturity: Adoption of new digital services to drive transformation and optimization inside an individual organization; Level 2 maturity: Adoption of cross-ecosystem capabilities that connect enterprises to ensure consumer focus and centricity.”*
Many healthcare organisations focus only on their own maturity without considering the maturity of their ecosystem. Gartner recommends, “CIOs involved in implementing and managing EHRs, telemedicine and other care delivery IT enable a range of stakeholders to participate in an open platform architecture by prioritizing digital capabilities that support consumer-centric or citizen-centric care.”* I agree.
To increase the maturity of your ecosystem, you need to think about using a digital platform that will work with different partners and leverage the vast amount of data from many sources that will be integral for patient-driven care. This platform will also allow your ecosystem partners to seamlessly participate in your value chain, contributing to the quality of health services delivered by your organisation for the benefit of patients.”
*Gartner, Healthcare Provider CIO Strategies for Scaling Digital Care Delivery Refreshed 11 September 2019, Published 8 March 2018
Patient-Driven Care: Creating a sustainable digital ecosystem
2019.10.30
“In the field of consumer research, self-control is often conceptualised as, and tested through, the ability or inability to abstain from ‘hedonic consumption’ — at its most base level, eating sugary, fatty foods.
According to this common conceptualisation, food decisions involve a trade-off between health and pleasure, where deciding on pleasure is associated with a self-control failure.
But, as the authors of Exerting Self-Control ≠ Sacrificing Pleasure argue, for a choice to constitute a self-control failure, it must be accompanied by anticipated regret and violate a long-term goal held by the consumer.
“Presented with the opportunity to eat cake or carrot sticks, a person intent on losing weight would experience a self-control failure when they choose to eat the cake and expect to regret having done so. Anticipated regret would signal that eating the cake violated a long-term goal of losing weight,” said Dr Irene Scopelliti, associate professor of marketing at Cass Business School.
“If the same person ate only a small piece of cake, however, they may not experience a self-control failure because they haven’t eaten enough to violate their goal of losing weight and trigger regret.”
[..] “Consumer behaviour researchers and psychologists are better placed to help consumers realise that they have a self-control problem, and to assist them in altering their perceptions of food so that tastiness and healthiness become more positively associated.
“By abandoning the idea that eating “bad foods” equals a self-control failure, consumers should find it easier to exert self-control, particularly if they are armed with the combined dietary knowledge of medically trained professionals and the behavioural knowledge of psychologists and consumer researchers.”
Exerting self-control does not mean sacrificing pleasure (research paper)
“Drug Shortages: Root Causes and Potential Solutions examines the underlying factors responsible for drug shortages and recommends enduring solutions.
[..] The report identifies three root causes for drug shortages:
- Lack of incentives for manufacturers to produce less profitable drugs;
- The market does not recognize and reward manufacturers for “mature quality systems” that focus on continuous improvement and early detection of supply chain issues; and
- Logistical and regulatory challenges make it difficult for the market to recover from a disruption.
The report also recommends enduring solutions to address drug shortages. These solutions include:
- Creating a shared understanding of the impact of drug shortages on patients and the contracting practices that may contribute to shortages;
- Developing a rating system to incentivize drug manufacturers to invest in quality management maturity for their facilities; and
- Promoting sustainable private sector contracts (e.g., with payers, purchasers, and group purchasing organizations) to make sure there is a reliable supply of medically important drugs.”
Report | Drug Shortages: Root Causes and Potential Solutions
“Ample evidence links healthy lifestyle behaviors to a decreased risk for onset of, or adverse health consequences associated with, chronic conditions like type 2 diabetes, obesity, chronic kidney disease and hypertension. Yet, relatively few individuals and communities are benefiting from effective, scalable behavior change interventions. Misalignment of incentives in the health system account for some of the current gap between the science of prevention and its implementation. Both public and private payers currently devote considerably fewer resources to prevention than they do to treatment—despite the fact that investments in prevention offer greater potential value, as measured by lower total costs of care and improved health outcomes.
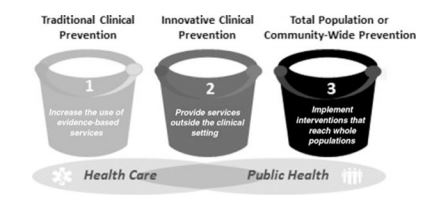
Auerbach J. The 3 Buckets of Prevention. J Public Health Management Practice
[..] the following seven barriers present challenges to scaling disease prevention programs in all three buckets:
- No clear efficacy and market validation pathways for prevention strategies such as those that exist for pharmaceuticals (e.g. clinical trial results, FDA approval).
- Long iteration cycles, sometimes spanning decades, for developing, testing, and improving disease prevention programs, leading to low levels of innovation that scale beyond local communities.
- Failure to appreciate the complexity of behavior change at scale, using methodologies such as human-centered design, choice architecture and other behavior change strategies.
- Sparse innovation pipeline, lack of financial incentives for investors to support entrepreneurs, and limited reimbursement incentives from insurers because benefits accrue to a more wide-ranging group of stakeholders
- Prevention paradox, where the highest number of cases are made up of low-risk individuals, making it difficult to identify appropriately targeted populations for prevention strategies.
- Difficulty to productize prevention strategies, as opposed to pharmaceuticals, which can more easily be distributed around the world with minimal marginal costs and impact on efficacy.
- Intra- and Inter-sectoral fragmentation of data, cultures, regulations, and incentives, all of which impede free exchange of ideas and collaborative implementation of new platforms, interventions, and strategies for improving health outcomes.
[..] The period for public comment begins on October 24, 2019. Email your responses to preventionx@hhs.gov, with the subject line “PreventionX RFI Comment” by December 13, 2019.”
Request for Information – PreventionX
“Self-insured, or self-funded plans, currently cover an estimated 94 million of the nation’s 156 million employees. Nearly 60% of all employees are covered in a plan that is fully or partially self-funded.
In a self-funded plan, employers take on the financial risk of providing healthcare benefits for their employees, as opposed to paying a predetermined premium to an insurer.
This approach saves between 20 and 30% of the cost of a traditional preferred provider organization, or PPO, plan, according to Kirk Fallbacher, CEO of Advanced Medical Pricing Solutions, or AMPS. This is about $2,800 per employee, per year, in savings.
[..] Of the typical insurance dollar spent, 21 cents is on just reserves — the money set aside by insurers to pay policyholders who have filed or who are expected to file claims — and 12 cents goes to administration, he [Kirk Fallbacher, CEO of Advanced Medical Pricing Solutions] said. This is in comparison to the self insured market, in which administration accounts for 5 cents of every dollar. Ninety percent of the dollar goes to paying claims.”
Self-insured employers are playing an increasing role in taking on the status quo to lower costs
“the Centers for Disease Control and Prevention estimated that 17% of the US population engaged in binge drinking, meaning that one in six reported doing so four or more times a month. In states that legalised adult use, the number of binge drinking sessions per month was 9% below the national average.
[..] many millennials have opted to consume cannabis over drinking alcohol. According to a MarketWatch article, a millennial said that she prefers to consume cannabis over alcohol because it saves her more money and doesn’t cause the intoxicating effects of alcohol.
[..] According to a Yahoo News poll in 2017, it was concluded that the majority of the 55 million marijuana users in the US are millennials, and as the number of alcohol consumption rates decline, the cannabis industry is expected to directly benefit as more users turn towards cannabis-based alternatives.”
US alcohol consumption falling as cannabis use increases
2019.10.29
Excerpt – “It’s absurd when you think about it,” Cohen said by phone. “Can you imagine finishing your meal at a restaurant and then handing over a credit card only to get a bill months later, followed by a collections agency that’s hired to chase you up? No, the credit card company takes on the responsibility right then and there.”
Here’s how it works: Once a patient gets seen by a health provider, the claim gets submitted to the insurance company, which adjudicates it and issues a payment to the hospital or clinic for the insurance portion of the bill. From there, Ooda quickly pays the provider for the patient’s portion of the bill, and Ooda and the insurer jointly manage what the patient owes.
[..] So why would insurers take on the liability when it wasn’t previously their problem?
Blue Shield of Arizona’s CEO Pam Kehaly says this was a “worry item” for her. But she’s willing to test it because the financial exposure for her plan is offset by the improvement in experience for members. And it will potentially mean fewer member grievances, and therefore lower costs to staff call centers.”
2019.10.28
Excerpt – While any reduction in new drug development might once have horrified lawmakers, many have now proven willing to advocate for the legislation on its merits, impact to innovation or not.
“About 97% to 95% of new drugs would still come to the market” under Pelosi’s plan, Rep. Anna Eshoo (D-Calif.), the House Energy and Commerce health subcommittee chair who represents a biotech-heavy Silicon Valley district, said at the hearing. “I wish it were 100%. … I wouldn’t have my name on the bill if I thought we were going to kill innovation in our country.”
For policy experts outside Washington, it’s a refreshing admission — even if it relies on dubious data.
“I think it’s actually good that there’s this acknowledgment you’d be sacrificing something,” said Stacie Dusetzina, a professor of health policy at Vanderbilt University. “It’s just hard to know exactly what you would be sacrificing.”
Dusetzina and others were quick to caution that pitting innovation against affordability is often a false choice, emphasizing that many new drugs do little to advance standards of care. Pelosi’s bill, she said, is unlikely to cap the price of innovative new drugs targeted at small patient populations.
Other lawmakers, however, rejected the suggestion that price reductions would result in less innovation, arguing that companies can and should reduce non-research spending perceived as excessive before cutting into their drug development endeavors.
“The CBO analysis did not consider the role of stock buybacks, the role of excessive executive compensation,” Rep. Ro Khanna (D-Calif.), whose district borders Eshoo’s, said in an interview. “There are corporate reforms that can be undertaken that would not trade off innovation.”
Besides, [Washington University in St. Louis law professor Rachel] Sachs argued, any debate regarding access to future drugs is incomplete without acknowledging the millions of American patients who struggle to afford medications that taxpayer-funded researchers and drug companies jointly spent billions to develop.
“It’s important to think not just about new drugs we have in the future, but how many people today don’t have access to drugs that have been on the market for years,” Sachs said. “What are we giving up when these prices don’t fall after decades of availability?”
2019.10.27
Excerpt – The W.H.O.’s decision has received substantial pushback, in part because the modern meaning of “addiction” is an uneasy amalgam of several contradictory legacies: a religious one, which has censured excessive drinking, gambling and drug use as moral transgressions; a scientific one, which has characterized alcoholism and drug addiction as biological diseases; and a colloquial one, which has casually applied the term to almost any fixation. People have written about behavioral addictions — to eating, sex and gambling — for centuries. In recent decades, some psychiatrists and counselors have even specialized in their treatment. But the idea that someone can be addicted to a behavior, as opposed to a substance, remains contentious.
Predictably, some of the W.H.O.’s staunchest critics are leaders in the gaming industry, many of whom fear that the new diagnostic label will further stigmatize their products, which have been smeared as promoting slothfulness, social ineptitude and violence. A sizable faction of scientists also disputes the idea that video games are addictive. The arguments against the validity of video-game addiction are numerous, but they generally converge on three main points: Excessive game play is not a true addiction but rather a symptom of a larger underlying problem, like depression or anxiety; the notion of video-game addiction emerges more from moral panic about new technologies than from scientific research and clinical data; and making video-game addiction an official disorder risks pathologizing a benign hobby and proliferating sham treatments. “It’s absolutely not an addiction,” says Andrew Przybylski, director of research at the Oxford Internet Institute. “This whole thing is an epistemic dumpster fire.” People enjoy and sometimes form all-consuming passions for countless activities — fishing, baking, running — and yet we don’t typically pathologize those.
[..] A substantial body of evidence now demonstrates that although video-game addiction is by no means an epidemic, it is a real phenomenon afflicting a small percentage of gamers. This evidence has emerged from many sources: studies indicating that compulsive game play and addictive drugs alter the brain’s reward circuits in similar ways; psychiatrists visited by young adults whose lives have been profoundly disrupted by an all-consuming fixation with gaming; striking parallels between video games and online gambling; and the gaming industry’s embrace of addictive game design.
[..] Timothy Fong, a professor of addiction psychology at the University of California, Los Angeles, says he is convinced that video-game addiction is real. “It’s quite possible and common to have both addiction and another mental or behavioral disorder simultaneously,” he told me, like depression or anxiety. “At least half the time, compulsive gamers come in with clinical histories and mind-sets that are essentially the same as patients with heroin addiction, alcoholism or gambling disorder. They have all the hallmarks.”
[..] For too long the concept of addiction has been fettered by models and frameworks too meager to accommodate its complexity. Addiction has been attributed solely or primarily to weak willpower, or neural circuitry gone awry, or the inherent dangers of drugs themselves. In both the medical community and the public consciousness, the conflation of addiction and chemical dependency has stubbornly persisted.
[..] Addiction is no longer considered synonymous with physiological dependence on a substance, nor can it be reduced to the activity of neurons in a few regions of the brain. Rather, experts now define addiction as a behavioral disorder of immensely complex origins. Addiction, they say, is compulsive engagement in a rewarding experience despite serious repercussions. And it results from a confluence of biology, psychology, social environment and culture. In this new framework, addictions to certain types of modern experiences — spinning virtual slot machines or completing quests in a mythical realm — are entirely possible.
[..] In the past decade, many researchers have argued persuasively that the brain-disease model of addiction has gained more prominence than it deserves. Neuroscientists have discovered that the relationship between the reward circuit and addiction is much more convoluted than is typically acknowledged. It turns out, for example, that only some addictive drugs, namely cocaine and amphetamine, dependably provoke huge releases of dopamine; many others — including nicotine and alcohol — do so inconsistently or hardly at all. Moreover, dopamine is not as closely linked to pleasure as once thought; it is much more important for wanting than liking, for anticipating or seeking out a reward than for enjoying it. And dopamine is involved in far more than reward and motivation; it is also important for memory, movement and immune-system regulation. But the explanatory power of neurobiology is so appealing that the basic tenets of the brain-disease model have seeped into public consciousness, popularizing a somewhat reductive understanding of addiction.
[..] As modern video games have become so immersive, their carefully composed dreamscapes have begun to offer a seductive contrast to the indifferent, and sometimes disappointing, world outside screens. Games, by definition, have rules; goals are often explicitly defined; progress is quantified. Although games frequently put players in challenging situations, they continuously offer tutorials, eliminate real-world consequences of failure and essentially guarantee rewards in exchange for effort. Games imbue players with a sense of purpose and accomplishment — precisely the kind of self-worth that can be so hard to attain in their actual lives, especially in a job market that can be punishing for the inexperienced.
[..] A huge component of reStart’s philosophy is the importance of maintaining relationships. “These guys have almost universally what I would call an intimacy disorder,” Cash told me. “They don’t really know how to build and maintain intimate relationships. The solution to addiction is connection. We are building a real recovery community with our guys. It’s all about building friendship and community that is face to face, in person, rather than online.”
[..] The economic and cultural ascendancy of video games has collided with a social crisis that we are only beginning to understand: the isolation, emotional stagnation and profound loneliness of American men. Recent surveys indicate that loneliness is reaching epidemic proportions among Americans. According to a 2018 Cigna survey, more than 40 percent of Americans feel that their relationships are not meaningful and that they are generally isolated from others; 20 percent rarely or never feel close to anyone. Young adults between 18 and 22 score higher on scales of loneliness than any other group.
[..] And while addiction was once regarded as a kind of vice or chemical thrall — and in more recent decades has been framed as dysfunctional neural circuitry — there is now a substantial body of research contextualizing addiction as a consequence of social isolation. People who are deprived of a dependable social network, or who have severe difficulty connecting with others, have a much higher risk of both developing an addiction and relapsing. Addiction itself can drastically magnify loneliness.
[..] He explained that even if he had technically been socializing while gaming — talking with other players on his headset — he had never been genuinely interested in their lives, nor they in his. In contrast, the relationships he developed during rehab, in the complete absence of games, felt sincere and enduring: “A lot of the guys I met there were some of the only people I could be totally honest with.”
Can You Really Be Addicted to Video Games?
“using basic grassroots activism tactics like online petitions, social media pressure, and an economic boycott targeting festival sponsors, artists and fans killed the idea of facial recognition at US music festivals. Now we need to do the same for sporting events, transportation, public housing, schools, law enforcement agencies, and all public places. And there’s no time to lose.
Facial recognition is spreading like an epidemic. It’s being deployed by police departments in cities like Detroit, disproportionately targeting low-income people of color. Immigration and Customs Enforcement (ICE) are using it to systematically comb through millions of driver’s license photos and target undocumented people for apprehension and deportation. Cameras equipped with facial recognition software are scanning thousands of people’s faces right now in shopping malls, casinos, big box stores, and hotels. Schools are using it to police our children’s attendance and behavior, with black and Latinx students most likely to end up on watch lists. Major airlines are rapidly adopting it as part of the boarding process. France is about to institute a national facial recognition database. Police and corporate developers in the UK are defending their use of the tech. In China, where authorities have already used facial recognition to arrest people out of crowds at music festivals, the government is making a face scan mandatory to access the Internet.
[..] When it comes to automated and insidious invasions of our personal lives and most basic rights, tech lobbyists and politicians sell a calculated brand of cynicism. They want us to believe that the widespread use of deeply creepy technology like facial recognition is a forgone conclusion, that we should get used to it, and that the only questions to address are how, where, and how quickly to roll it out. We can prove them wrong, by channeling our ambient anxiety and online outrage into meaningful action and political power.
Surveillance profiteers who hope to make a lot of money selling facial recognition software to governments and private interests are now on high alert. They’re watching closely for public reactions, running tests to see just how much intrusive monitoring we’re willing to put up with. They’re manipulatively calling for regulation –– a trap intended to assuage public fears while hastening adoption. They’re promising that facial recognition can be done in an “opt-in,” manner, ignoring the inherent dangers in corporate harvesting and storing of biometric data. But we can draw a line in the sand now, and shut down this unethical human experiment by pushing for legislation to ban facial recognition, and refusing to support corporations who use it.”
Opinion: How Artists And Fans Stopped Facial Recognition From Invading Music Festivals
“The October 22 announcement starts with: “U.S. Sens. Mark R. Warner (D-VA), Josh Hawley (R-MO) and Richard Blumenthal (D-CT) will introduce the Augmenting Compatibility and Competition by Enabling Service Switching (ACCESS) Act, bipartisan legislation that will encourage market-based competition to dominant social media platforms by requiring the largest companies to make user data portable – and their services interoperable – with other platforms, and to allow users to designate a trusted third-party service to manage their privacy and account settings, if they so choose.”
Although the scope of this bill is limited to the largest of the data brokers (messaging, multimedia sharing, and social networking) that currently mediate between us as individuals, it contains groundbreaking provisions for delegation by users that is a road map to privacy regulations in general for the 21st century.
The bill’s Section 5: Delegation describes a new right for us as data subjects at the mercy of the institutions we are effectively forced to use. This is the right to choose and delegate authority to a third-party agent that can manage interactions with the institutions on our behalf. The third-party agent can be anyone we choose, subject to their registration with the Federal Trade Commission. This right to digital representation by an entity of our choice with access to the full range of our direct control capabilities is unprecedented, as far as I know.
“The problem with HIPAA, and with Europe’s General Data Protection Regulation (GDPR), is a lack of agency for the individual data subject. These regulatory approaches presume that all of the technology is controlled by our service providers and none of the technology is controlled by the us as data subjects. There are major limitations to this approach.
[..] a right to delegate control gives the data subject a lot more market power in highly concentrated markets like communications or hospital networks where effective and differentiated competition is scarce. A patient, for example, will have a choice among hundreds of digital representatives even when that patient is in a market served by only one or two hospital networks. These digital representatives will compete on a national scale even as our provider choices are limited by geography or employment.
[..] the advent of patient-controlled technology enabled by mandated delegation means that machine learning, artificial intelligence, and expertise in general, can now move closer to patient. For example, patient groups that share a serious disease can organize as a cooperative to make the best use of their health records and hire expert physicians and engineers to design and operate the delegate.
[..] the right to specify a delegate means that, for the first time, our service providers will have to come to us. Under the current practice, patients are forced to navigate different user interfaces, portal designs, privacy statements, and associated dark patterns designed to manipulate us in different ways by each of our service providers. We are forced to figure out the idiosyncrasies of every service provider afresh. A right to delegation means that patients will have a consistent user interface and a more consistent user experience across our service providers even if the delegate is relatively dumb in the expert systems sense.
The ACCESS Bill is a breakthrough because it extends our right to choose a delegate to the digital institutions that are now deeply embedded in our lives.”
ACCESS Act Points the Way to a Post-HIPAA World
“smoking is a major modifiable factor, with an estimated 1 billion deaths expected due to tobacco use in the 21st century. However, none of the 49 articles that received the highest news and social media coverage in 2017 and 2018 focused specifically on tobacco. Most articles with top 100 Altmetric scores were related to nutrition, diet, or obesity (29 of 49, 59%). Obesity is also a leading global problem, but only 3 of these 29 Altmetric top 100 articles were directly about obesity; the other 26 articles addressed specific nutrients, foods, supplements, or popular diet patterns. Only 2 of these 29 articles reported null findings. Typically, the articles that attracted most attention dealt with factors that might confer risks of very small magnitude, if any. For example, 3 widely disseminated articles were about coffee and prolonged life expectancy. Even when risk factors with large risks were assessed, for example, alcohol (5 of 49 articles), emphasis was usually placed not on the huge, unequivocal risks of alcoholism, but on the debatable risks of low alcohol intake.
In these 49 Altmetric top 100 articles, tobacco or obesity were underrepresented and dietary choices were overrepresented, whereas exercise appeared more evenly covered. Exercise is also an important lifestyle choice that has major consequences, and appropriately 11 of 49 articles referred to exercise-related themes. A few remaining articles addressed various other topics (sleep, dog ownership, living close to high traffic, smartphone use, social media use, pubic hair grooming, and stress).
[..] Effective dissemination of public health messages may need to focus on a few, powerful, easily understood, uncontentious pieces of advice. For example, uncontested, major recommendations include the following: do not smoke (or quit smoking), exercise regularly, do not eat too much, do not become obese, do not drink alcohol in excess, and sleep well. Conversely, the current informational cloud quickly becomes overpopulated with confusing minutiae. With limited mention of the major causes of death, the average person is bombarded with conflicting trivial messages about purported benefits of various nutrients, is prodded to improve health by owning dogs, or is stressed about modern smartphones and social media exposure. Even in countries with the best public health infrastructure (such as Switzerland), many people know only a small portion of the most essential facts about health. Given this rampant global health risk innumeracy, communicating secondary issues may be largely a fruitless detracting nuisance.”
[..] To maximize benefits in public health action, scientists and others need to carefully select the targets. These targets should be major issues for which well-meaning, informed people will have sufficient certainty to be united in their recommendations. Trying to propel long laundry list agendas with uncertain, contentious items may cause confusion and be ineffective. The responsibility for disseminating balanced, true, science-based information is shared by editors and authors of scientific articles, institutions and journals who prepare press releases,10 and media eager to offer coverage. Observational studies touting small effects despite high risk of confounding and selection biases should rarely be published by general medical journals. These reports should be placed in specialist journals with proper acknowledgment of their limitations in the Abstract. Absolute differences, and not relative differences, should be the primary approach to communication. Regardless of where they get published, these articles should not be accompanied by press releases. News media should substantially reduce coverage of such studies; doing so will help strengthen their reputation for seriousness.”
Neglecting Major Health Problems and Broadcasting Minor, Uncertain Issues in Lifestyle Science
“In April 2015, New York implemented one of the first state laws addressing surprise out-of-network billing at in-network facilities in both emergency and non-emergency situations (other than a few exemptions). Patients enrolled in fully-insured, state-regulated health insurance products can now contest surprise bills in these situations, in which case the patient is only responsible for in-network cost-sharing amounts. If the insurer and out-of-network provider(s) are unable to agree on a payment amount, disputes are settled by a final-bid, “baseball-style” arbitration process – what the state refers to as independent dispute resolution (IDR) – in which the arbiter must decide whether final payment should be the insurer’s initial allowed amount or the provider’s charges.
The biggest concern raised about NY’s arbitration process is the state’s guidance that arbiters should consider the 80th percentile of billed charges (as calculated by FAIR Health, an independent insurance claims database) when determining the final payment amount. Providers’ billed charges, or list prices, are unilaterally set, largely unmoored from market forces, and generally many times higher than in-network negotiated rates or Medicare rates.
[..] the New York Department of Financial Services report finds that arbitration decisions have averaged 8% higher than the 80th percentile of charges.
[..] Therefore, it is likely that the very high out-of-network reimbursement now attainable through arbitration will increase emergency and ancillary physician leverage in negotiations with commercial insurers, leading either to providers dropping out of networks to obtain this higher payment, extracting higher in-network payment rates, or some combination thereof, which in turn would increase premiums. If insurers are additionally increasing out-of-network payment for services in order to reduce the risk of losing in arbitration, that would further amplify this inflationary impact on premiums.
[..] even arbitration decisions in favor of the health plan have averaged only 11% below the 80th percentile of charges, still far above in-network rates or typical out-of-network payments – implying that health plans only “win” in arbitration when they offer to pay extremely high rates, which is then paid for through higher premiums.”
Experience with New York’s arbitration process for surprise out-of-network bills
“The money paid to AbbVie buys a package of services that includes outreach and testing to identify patients as well as the drugs to treat them. But the price and other details of the deal are secret under the Washington state Public Records Act, even though they involve massive commitment of taxpayer dollars.
Washington officials said they’re prohibited from releasing details by federal rules that hide drug pricing to protect what companies consider trade secrets. Lawyers for the three pharmaceutical firms that submitted bids vowed to go to court to halt the release of bid documents requested by Kaiser Health News under state public records laws.
Without transparency about the details, however, it is impossible to evaluate whether the spending amounts to smart public policy or a boondoggle that primarily benefits manufacturers hoping to lock down payments of perhaps $10,000 per patient for drugs from Medicaid. The same drugs from the same manufacturers can cost less than $100 per course of treatment in other parts of the world.
Under the new contract, officials expect to spend about the same amount of money per year, while treating twice as many patients, said Dr. Judy Zerzan, chief medical officer for the Washington State Health Care Authority.
That works out to more than $321 million to treat about 30,000 patients over four years, with options for two-year extensions.
But that would be an improvement over the nearly $387 million state officials have spent since 2014 to treat just 10,377 people, according to state records. That works out to an average cost of $37,259 apiece, though actual fees vary by program.
[..] Another reason it’s a race for the drugmakers: The overall market for hepatitis C drugs has been “falling fast,” as more patients are treated and cured, Carr said.
“The companies are trying to find a way to ensure the remaining patients use their drug,” Carr said. “[They] have a lot less leverage than they once had, and that’s why they’re willing to do these deals.”
[..] In Washington, the arrangement would treat about half of those in the state infected with hepatitis C, but the average per-patient cost would be about 40% less than before the deal, Zerzan said.
Hepatitis C poses dilemmas for public health officials and drugmakers alike.
Louisiana has been under pressure from the American Civil Liberties Union regarding prisoners who said they were denied effective hepatitis C treatment. And Washington state’s Department of Corrections faces at least one lawsuit from a prisoner who said he was denied timely care for his disease.
In Washington, Gov. Jay Inslee directed health officials last year to negotiate the best deal to eliminate hepatitis C in the state by 2030, which mirrors goals of global health agencies.”
Pharma Sells States On ‘Netflix Model’ To Wipe Out Hep C. But At What Price?
2019.10.26
“In both the U.K. and the U.S. the rapid growth in vaping has coincided with rapid reductions in smoking rates, especially among young people. Yet there is a stark contrast between the two countries in how vaping has been treated by public health authorities and, as a result, in its safety for users.
In Britain, vaping is all about nicotine, not drugs. It is socially acceptable and is confined almost entirely to people who have smoked, even among the young. Less than 1% of vapers are people who have never smoked, and there is little sign of young people taking it up faster than they would have taken up smoking.
There are now 3.6 million vapers in the U.K. and 5.9 million smokers (some people are in both categories). Many British smokers have switched entirely to vaping, encouraged by the government, whose official position is that vaping is 95% safer than smoking, an assertion now backed by early studies of disease incidence. The organizations that have signed a statement saying that vaping is significantly less harmful than smoking include Public Health England, the Association of Directors of Public Health, the Royal College of Physicians and the Royal Society for Public Health.
There have been no deaths and few if any cases of lung illness directly attributed to vaping in the U.K. A recent study has concluded that vaping is now helping up to 70,000 people stop smoking every year by reaching those who failed to quit smoking by other means. “The British public have voted with their feet and are choosing to use e-cigarettes. This is a positive choice, and we should promote it,” says Prof. Linda Bauld of Cancer Research U.K.
[..] Why the different experience? The CDC says that most cases of illness are linked to vaping products laced with THC oil, an ingredient of cannabis, “particularly those obtained off the street or from other informal sources (e.g., friends, family members, illicit dealers).” In addition, many American nicotine e-cigs are much stronger than those allowed in Britain, where there is a 2% limit on nicotine concentrations under the EU’s Tobacco Products Directive. A typical Juul is nearly three times as strong.
In Britain, a manufacturer or importer of e-cigarettes must submit a notification to the authorities six months in advance of a product launch and is subject to strict product-safety regulations, including toxicological testing of the ingredients and emissions, as well as rules ensuring tamper-proof and leakproof packaging. Stimulants, colorings and vitamin additives are tightly regulated.
Few such regulations exist in the U.S. For many observers, this explains the higher injury rate: “What’s happening in the U.S. is not happening here [in Britain], nor is it happening in any other countries where vaping is common,” says John Britton, director of the U.K. Centre for Tobacco & Alcohol Studies at Nottingham University.
Of course, neither country has gotten everything right. In Britain, the vaping industry argues that some restrictions prevent lifesaving interventions. Philip Morris International —which has developed heat-not-burn products to compete with the rise of vaping and now promises a “smoke-free future”—would like to insert slips into cigarette packs urging smokers to switch, but the ban on advertising e-cigarettes prevents this. And in both countries independent vaping firms argue that strict regulations act as barriers to entry that favor big firms.”
“In binary classification (e.g., disease vs no disease), the area under the receiver operating characteristic curve (AUROC), sensitivity, and specificity are commonly presented [..]. The receiver operating characteristic curve shows sensitivity and 1–specificity values for all possible cutoffs. AUROC is commonly used to summarise the general performance of a classification algorithm.
However, few studies evaluate accuracy (i.e., total number of correct classifications divided by total number of cases), positive predictive value, or negative predictive value when reporting classification-related results. Although AUROC provides a general evaluation of the deep learning-based classification performance, for further clinical implementation, a specific classification threshold must be chosen. By altering the classification threshold, the sensitivity, specificity, positive predictive value, and negative predictive value will change accordingly. The classification threshold is commonly selected to maximise informedness, as measured by Youden’s index, which is a balanced maximisation of sensitivity and specificity. When presented with imbalanced datasets, evaluation of algorithm performance based solely on AUROC, sensitivity, and specificity has limitations and should be interpreted with care. When we evaluated a dataset with a small proportion of disease cases (5%), the deep learning algorithms showed an AUROC of 0·957, which appears to suggest excellent classification performance with relatively high specificity of 89·8% and sensitivity of 98·6%. However, when the same data were evaluated using the precision–recall curve, which is meant to show the trade-off between recall (i.e., sensitivity) and precision (i.e., positive predicted value), the area under the precision–recall curve (AUPRC) was only 0·348, suggesting that the deep learning algorithm had poor precision (i.e., among cases that were positive according to the deep learning algorithm, the probability of actually having disease was low). [..] depending on the nature of the datasets (i.e., large or small number of cases) and the purpose of evaluations (i.e., in addition to general evaluation of detection performance), AUPRC, positive predictive value, and negative predictive value are useful complementary assessments to conventional evaluations of AUROC, sensitivity, and specificity.

In view of the limitations in presenting results of deep learning algorithms based on just one or very few methods, as illustrated earlier, we describe statistical methods that should be considered when evaluating different types of health outcomes. Overall, different measures and ways of reporting should be considered depending on the aims, context, and outcome of the study.”
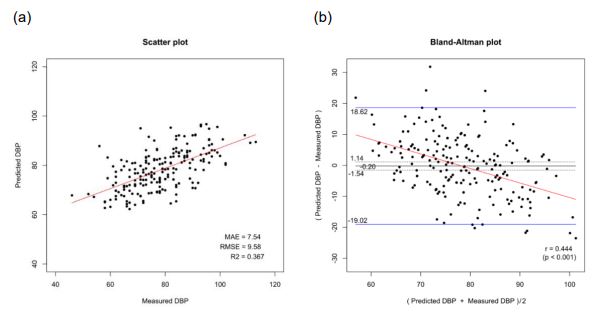
(a) Scatter plot shwoing a positive linear association between the predicted and clinically measured diastolic blood pressure, (b) Bland-Altman plot (difference between the predicted and clinically measured diastolic blood pressure [y-axis] against the average of the two)
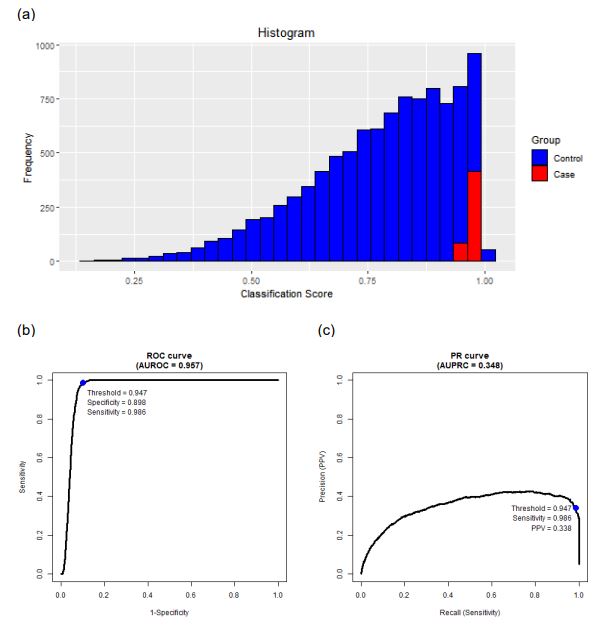
(a) Histogram showing an empirical distribution of simulated data, (b) Receiver operating characteristic (ROC) curve suggesting good performance, (c) Precision-recall (PR) curve suggesting a limited performance in precision
Reporting on deep learning algorithms in health care
“VPC [virtual primary care] organisations might also engage in risk selection, intentionally selecting or seeking to attract less complex patients. Furthermore, VPC services might be unsuitable for people requiring regular access to highly personalised or multidisciplinary services. When less complex patient groups deregister from their existing practices to register with practices that offer virtual services, as in England, the result is that brick-and-mortar GPs [general practitioners] are left with increasingly complex patient lists.
This segmentation of the patient population by risk is analogous to adverse selection in private health insurance markets, and might threaten the financial sustainability of traditional GP practices in a capitated payment scheme. For example, under the General Medical Services contract, most GPs in England receive a base payment of £87·92 per patient, with additions taking account of factors such as sex, age, rurality, deprivation, and turnover of patients, as well as measures of morbidity and mortality. GPs can earn additional income for achieving performance targets and for providing extra services, such as minor surgical procedures. Including these additions, the average income per patient, per year for GPs in England is £152, whereas Babylon receives, on average, about £90 per patient registered with GP at Hand.4 This might partially account for the disparity in the complexity of patient lists, but given that a small proportion of patients with particularly complex needs accounts for the majority of health-care costs,5 it likely still represents an overpayment of VPC relative to traditional GP services.
VPCs might also introduce cost inflation and cost shifting, which is partly due to their high registration and turnover rates. [..] There is also a risk that patients who are unable to access the services they need from their VPC provider, or are simply dissatisfied with the service, might make heavier use of the National Health Service (NHS) 111 non-emergency phone line or walk-in services. [..] Overuse is also a potential issue: one study suggested that as many as 88% of remote consultations represented new activity, as opposed to activity replacing a traditional consultation. Finally, whether VPC services such as Babylon, which prioritise access, can adequately ensure continuity of care is unclear. This is a significant concern, given the growing evidence on the benefits of a long-term therapeutic relationship between a patient and a GP in terms of patient experience, outcomes, and cost. [..]
On this basis, the economic case for simply adding VPCs onto existing systems without adaptation of payment models is weak. Over time, it will likely result in higher costs and less innovation in care delivery. [..] A more sensible approach would be to create a unified system of physical and virtual primary care services. This would enable patients to access VPC services without foregoing access to their GPs, and the allocation of funds would reflect providers’ actual contributions to their patients’ health.”
Virtual primary care: fragmentation or integration?
2019.10.25
“Materials and Methods: A custom software system was developed for home hemodialysis patients to use in an RPM [remote patient monitoring] setting, with focus on emoticon sharing and sentiment analysis of patients’ text data. We analyzed the outcome of emoticon and sentiment against TTD [technically troubled dialysis]. Logistic regression was used to assess the relationship between patients’ emotions (emoticon and sentiment) and TTD.
Results: Usage data were collected from January 1, 2015 to June 1, 2018 from 156 patients that actively used the app system, with a total of 31 159 dialysis sessions recorded. Overall, 122 patients (78%) made use of the emoticon feature while 146 patients (94%) wrote at least 1 or more session notes for sentiment analysis. In total, 4087 (13%) sessions were classified as TTD. In the multivariate model, when compared to sessions with self-reported very happy emoticons, those with sad emoticons showed significantly higher associations to TTD (aOR 4.97; 95% CI 4.13–5.99). Similarly, negative sentiments also revealed significant associations to TTD (aOR 1.56; 95% CI 1.22–2) when compared to positive sentiments.
Discussion: The distribution of emoticons varied greatly when compared to sentiment analysis outcomes due to the differences in the design features. The emoticon feature was generally easier to understand and quicker to input while the sentiment analysis required patients to manually input their personal thoughts.
[Discussion] patients prefer to use emoticons over writing session notes. The emoticon feature requires only a swipe of the finger to input and is relatively easy to understand while session notes require manually typing 1 or more sentences. As such, the majority of dialysis sessions did not contain a corresponding session note. However, if viewed in regard to TTD sessions, a higher proportion of patients do spend the time to write session notes. When compared to the emoticon entered by the patients, the content of the session notes appears to be more valuable, as it was something which patients felt was necessary for their healthcare professionals to know. Nevertheless, the negative emotions derived from both emoticons and sentiment analysis have been shown to be significantly associated with TTD, highlighting the usefulness of both features.”
Emotion sharing in remote patient monitoring of patients with chronic kidney disease
“We’re taking money from the things we need to work on. You are taking the money,” said Commissioner Don Berwick to the panel, consisting of executives from Partners Healthcare, Boston Children’s Hospital, Beth Israel Lahey Health, Atrius Health and Signature Healthcare. “The silence when (asked) will you reduce costs is deafening… Not 3.1 percent increase per year. That’s not cost reduction. That’s cost increase at a multiple of the rate of inflation. If the leaders of the most prestigious groups in the commonwealth won’t say ‘We will reduce costs,’ … I don’t see a solution.”
Health care leaders grapple with how to lower spending, not just slow growth
“we find substantial disparities in health conditional on risk but little disparity in costs. On the one hand, this is surprising: Health care costs and health needs are highly correlated, as sicker patients need and receive more care, on average. On the other hand, there are many opportunities for a wedge to creep in between needing health care and receiving health care—and crucially, we find that wedge to be correlated with race [..]. At a given level of health (again measured by number of chronic illnesses), Blacks generate lower costs than Whites—on average, $1801 less per year, holding constant the number of chronic illnesses (or $1144 less, if we instead hold constant the specific individual illnesses that contribute to the sum). [..] Black patients generate very different kinds of costs: for example, fewer inpatient surgical and outpatient specialist costs, and more costs related to emergency visits and dialysis. These results suggest that the driving force behind the bias we detect is that Black patients generate lesser medical expenses, conditional on health, even when we account for specific comorbidities. As a result, accurate prediction of costs necessarily means being racially biased on health.
[..] This mechanism of bias is particularly pernicious because it can arise from reasonable choices: Using traditional metrics of overall prediction quality, cost seemed to be an effective proxy for health yet still produced large biases. After completing the analyses described above, we contacted the algorithm manufacturer for an initial discussion of our results. In response, the manufacturer independently replicated our analyses on its national dataset of 3,695,943 commercially insured patients. This effort confirmed our results—by one measure of predictive bias calculated in their dataset, Black patients had 48,772 more active chronic conditions than White patients, conditional on risk score—illustrating how biases can indeed arise inadvertently.
To resolve the issue, we began to experiment with solutions together. As a first step, we suggested using the existing model infrastructure—sample, predictors (excluding race, as before), training process, and so forth—but changing the label: Rather than future cost, we created an index variable that combined health prediction with cost prediction. This approach reduced the number of excess active chronic conditions in Blacks, conditional on risk score, to 7758, an 84% reduction in bias. Building on these results, we are establishing an ongoing (unpaid) collaboration to convert the results [..] into a better, scaled predictor of multidimensional health measures, with the goal of rolling these improvements out in a future round of algorithm development. Of course, our experience may not be typical of all algorithm developers in this sector. But because the manufacturer of the algorithm we study is widely viewed as an industry leader in data and analytics, we are hopeful that this endeavor will prompt other manufacturers to implement similar fixes.
These results suggest that label biases are fixable. Changing the procedures by which we fit algorithms (for instance, by using a new statistical technique for decorrelating predictors with race or other similar solutions) is not required. Rather, we must change the data we feed the algorithm—specifically, the labels we give it. Producing new labels requires deep understanding of the domain, the ability to identify and extract relevant data elements, and the capacity to iterate and experiment. But there is precedent for all of these functions in the literature and, more concretely, in the private companies that invest heavily in developing new and improved labels to predict factors such as consumer behavior. In addition, although health—as well as criminal justice, employment, and other socially important areas—presents substantial challenges to measurement, the importance of these sectors emphasizes the value of investing in such research. Because labels are the key determinant of both predictive quality and predictive bias, careful choice can allow us to enjoy the benefits of algorithmic predictions while minimizing their risks.”
Dissecting racial bias in an algorithm to manage the health of populations
“Major alcohol and tobacco firms have invested billions of dollars in Canadian cannabis. Similar investments will probably occur in the USA if cannabis legalisation becomes national policy. National legalisation in the USA would also provide strong constitutional protection for the promotion of cannabis products to adults.
A major determinant of the public health effect of cannabis legalisation will be the effect that it has on alcohol use. The substitution of cannabis for alcohol would produce substantial public health gains, but any increase in the combined use of alcohol and cannabis could increase harm. The literature to date is unclear on which outcome is more probable. Similar uncertainties exist about the effects of cannabis legalisation on tobacco smoking. The claim that medical use of cannabis for pain relief has reduced deaths from opioid overdose is based on weak evidence.
An important source of uncertainty is the longer-term effect of legalisation and regulation on cannabis prices and potency. Prices have fallen steeply and potency increased in some US states, and both trends could be amplified if biotechnology companies are able to produce cheaper cannabinoids on a large scale using biosynthesis.
Legal recreational cannabis markets might not reach maturity for at least another 10 years. Only then can an assessment be done to evaluate whether cannabis legalisation has increased cannabis use and harms; reduced or increased the use of alcohol, tobacco, and opioids; or resulted in other adverse social effects that could offset the social benefits of eliminating criminal penalties to allow adults to use cannabis for pleasure.
Alcohol regulation policies suggest that in the long term, commercialisation of cannabis will increase the frequency of use among people who use cannabis, a trend already observed in the USA. In the long term, the population prevalence and intensity of use will probably increase as cannabis becomes more socially acceptable, prices fall further, access increases, and new products are developed and marketed. Promotion of more potent cannabis products could increase the risks of dependence and other harms.
Cannabis legalisation will make clinical trials of medicinal uses easier. It will also result in easier study of the adverse health effects of regular cannabis use (by increasing the number of people who regularly use and the duration of their use). However, by the time information regarding costs and benefits of legislation becomes available, legalisation might be difficult to reverse because a profitable commercial cannabis industry will have been created that contributes substantial revenue to governments.”
“We did a global review to synthesise data on the prevalence, harms, and interventions for stimulant use, focusing specifically on the use of cocaine and amphetamines. Modelling estimated the effect of cocaine and amphetamine use on mortality, suicidality, and blood borne virus incidence. The estimated global prevalence of cocaine use was 0·4% and amphetamine use was 0·7%, with dependence affecting 16% of people who used cocaine and 11% of those who used amphetamine. Stimulant use was associated with elevated mortality, increased incidence of HIV and hepatitis C infection, poor mental health (suicidality, psychosis, depression, and violence), and increased risk of cardiovascular events. No effective pharmacotherapies are available that reduce stimulant use, and the available psychosocial interventions (except for contingency management) had a weak overall effect. Generic approaches can address mental health and blood borne virus infection risk if better tailored to mitigate the harms associated with stimulant use. Substantial and sustained investment is needed to develop more effective interventions to reduce stimulant use.”
Responding to global stimulant use: challenges and opportunities
“Methods: We developed a comprehensive framework for real-world evidence that enables comparative effectiveness and safety evaluation across many drugs and outcomes from observational data encompassing millions of patients, while minimising inherent bias. Using this framework, we did a systematic, large-scale study under a new-user cohort design to estimate the relative risks of three primary (acute myocardial infarction, hospitalisation for heart failure, and stroke) and six secondary effectiveness and 46 safety outcomes comparing all first-line classes across a global network of six administrative claims and three electronic health record databases. The framework addressed residual confounding, publication bias, and p-hacking using large-scale propensity adjustment, a large set of control outcomes, and full disclosure of hypotheses tested.
Findings: Using 4·9 million patients, we generated 22 000 calibrated, propensity-score-adjusted hazard ratios (HRs) comparing all classes and outcomes across databases. Most estimates revealed no effectiveness differences between classes; however, thiazide or thiazide-like diuretics showed better primary effectiveness than angiotensin-converting enzyme inhibitors: acute myocardial infarction (HR 0·84, 95% CI 0·75–0·95), hospitalisation for heart failure (0·83, 0·74–0·95), and stroke (0·83, 0·74–0·95) risk while on initial treatment. Safety profiles also favoured thiazide or thiazide-like diuretics over angiotensin-converting enzyme inhibitors. The non-dihydropyridine calcium channel blockers were significantly inferior to the other four classes.
Interpretation: This comprehensive framework introduces a new way of doing observational health-care science at scale. The approach supports equivalence between drug classes for initiating monotherapy for hypertension—in keeping with current guidelines, with the exception of thiazide or thiazide-like diuretics superiority to angiotensin-converting enzyme inhibitors and the inferiority of non-dihydropyridine calcium channel blockers.”
Click here to access interactive infographic
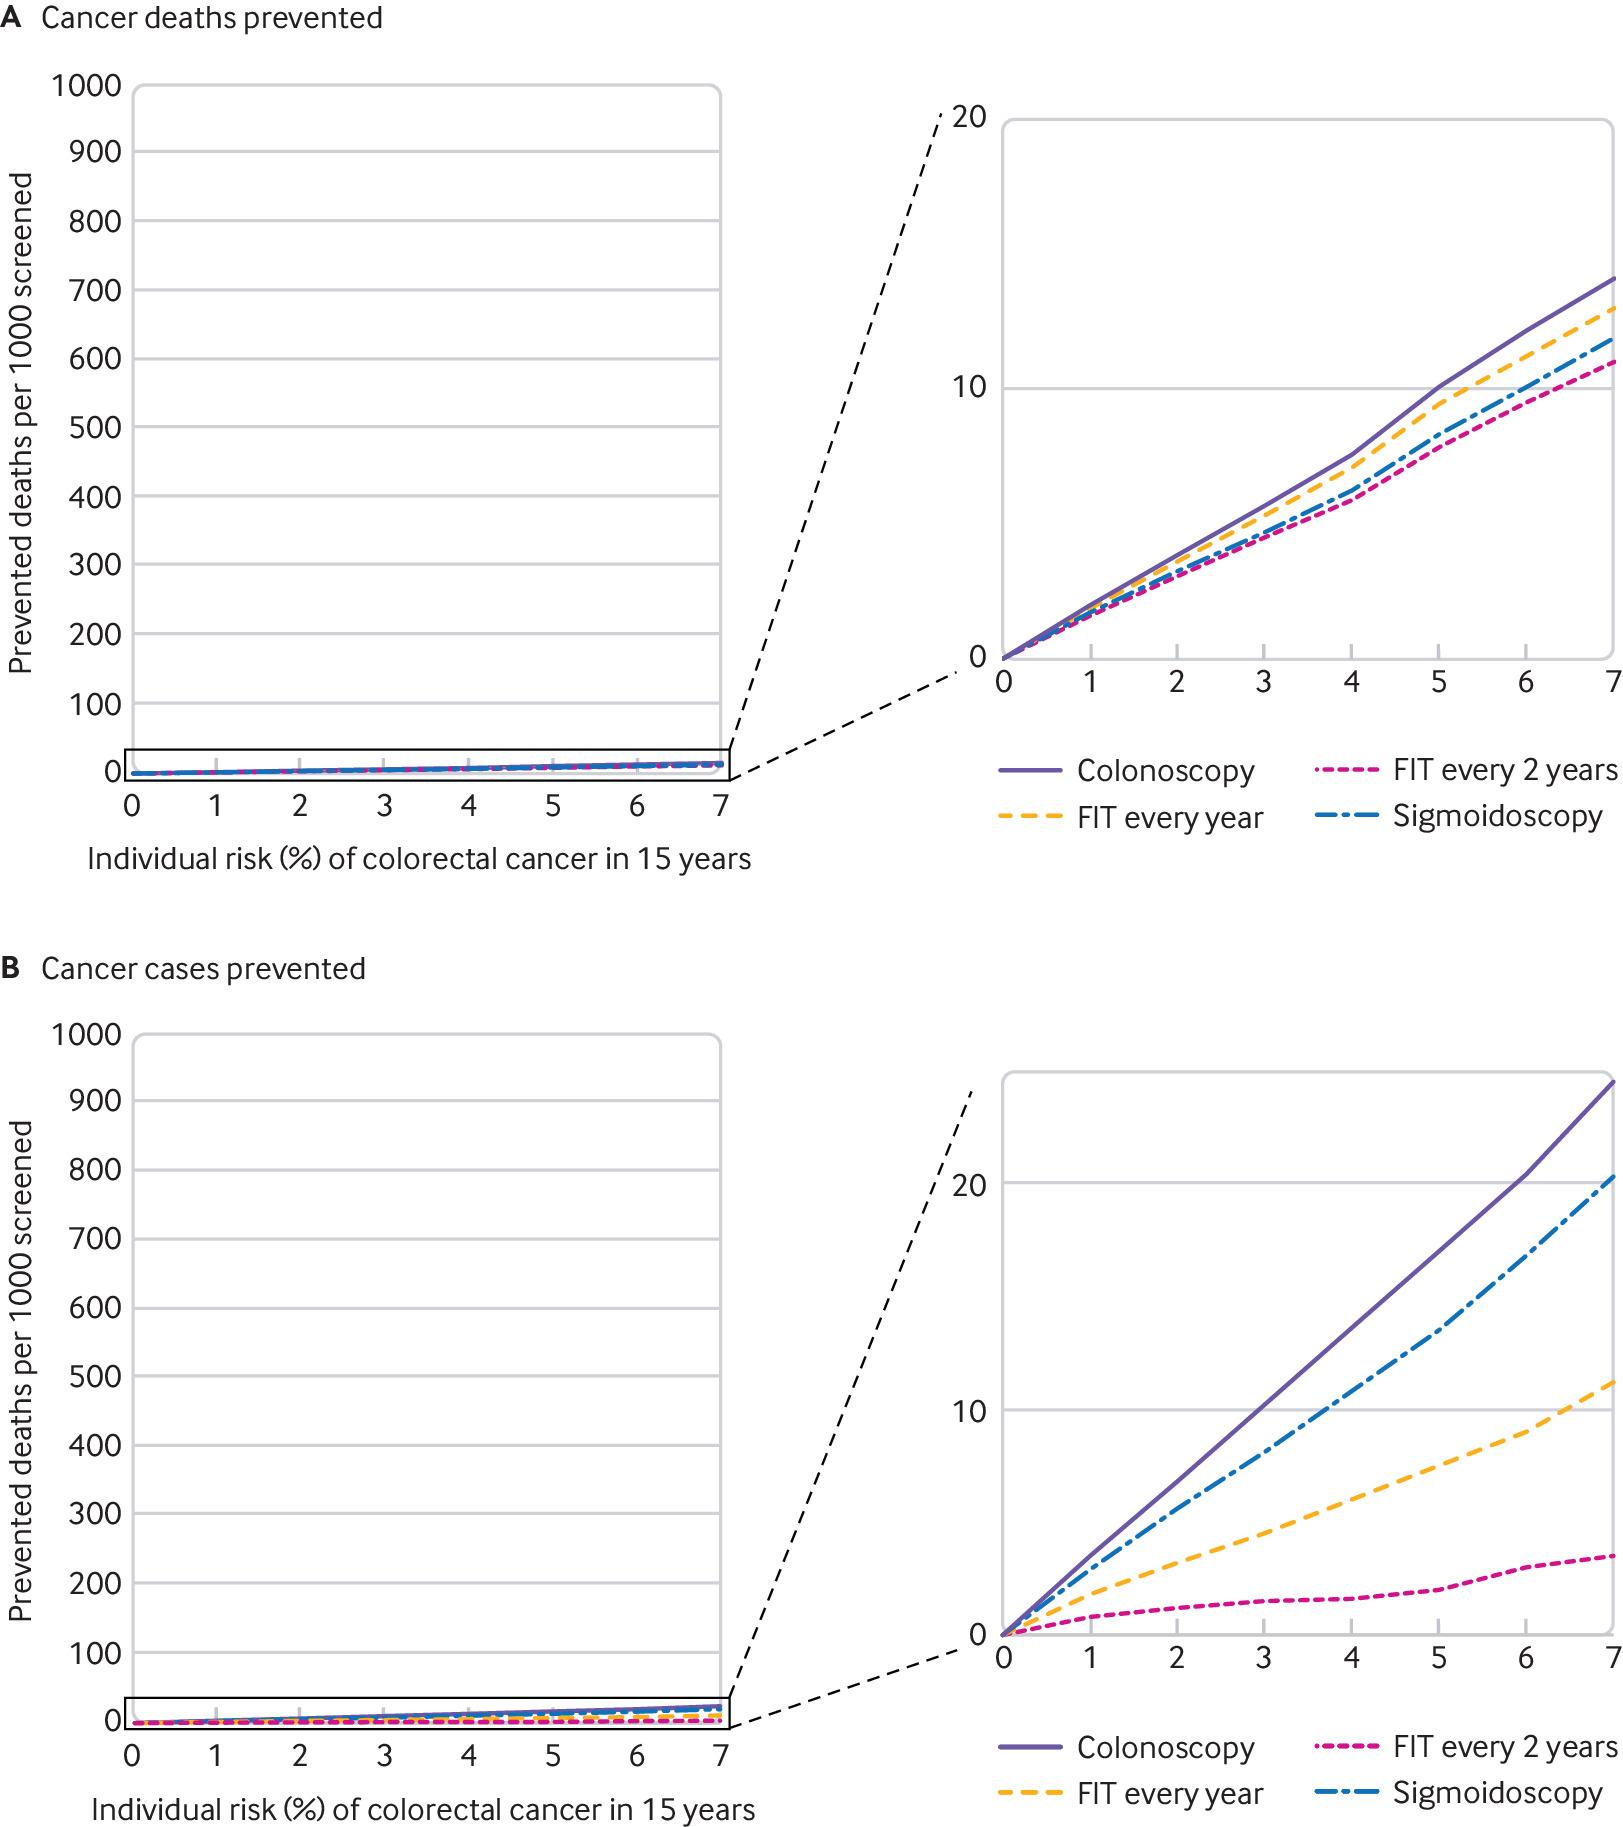 Number of colorectal cancer deaths (a) and (b) cases prevented by different screening options per 1000 screened individuals, stratified by individuals’ 15-year risk of colorectal cancer”
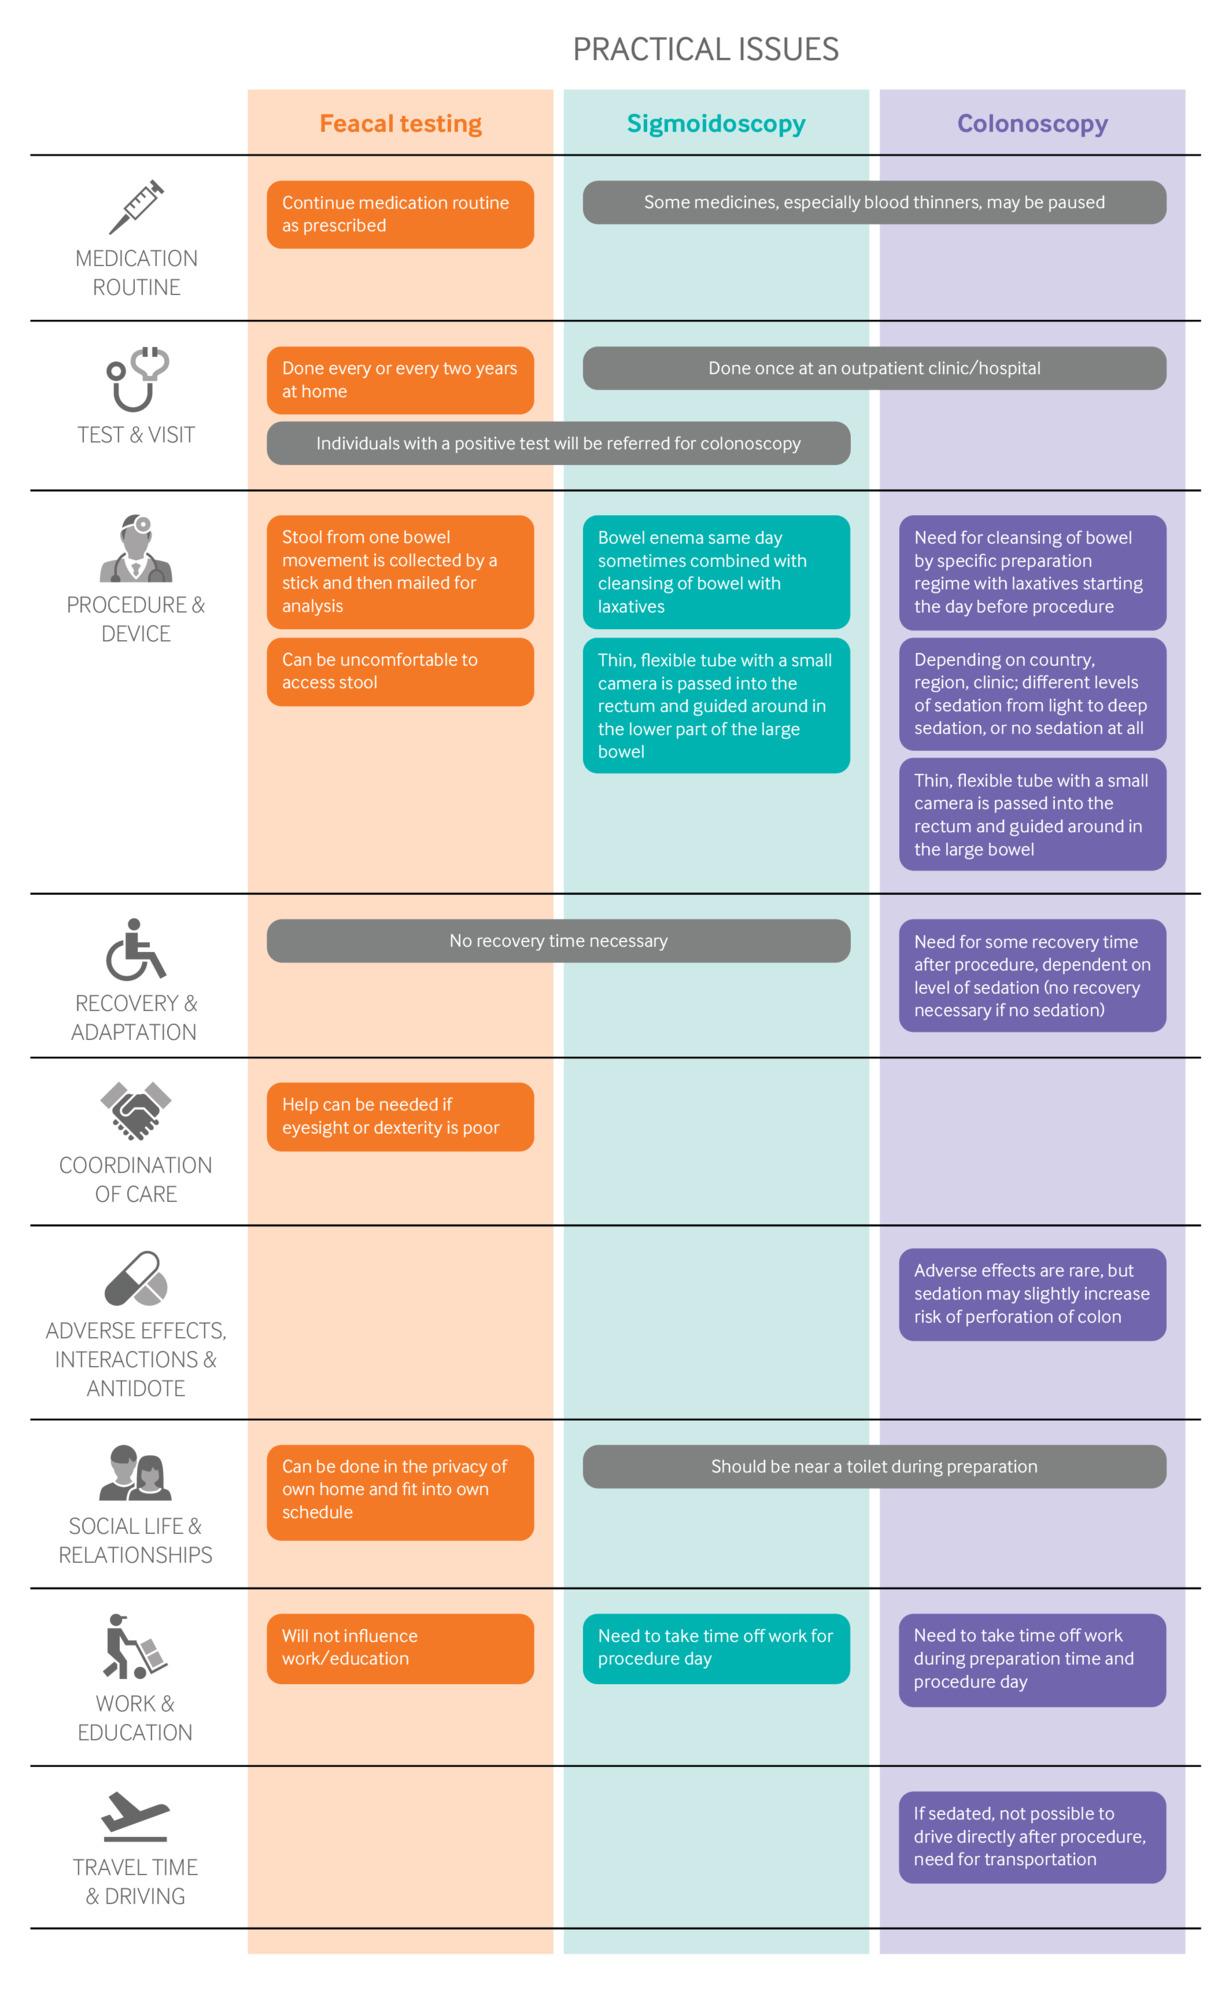 Practical issues for the different methods for colorectal cancer screening
“All the modelling data are of low certainty. It is a useful indication, but there is a high chance that new evidence will show a smaller or larger benefit, which in turn may alter these recommendations. Compared with no screening, the model estimates that:
- Colorectal cancer mortality may be reduced similarly by all four screening tests
- FIT every two years (relative risk 0.5)
- FIT every year (relative risk 0.41)
- Single sigmoidoscopy (relative risk 0.48)
- Single colonoscopy (relative risk 0.37)
- Colorectal cancer incidence
- May be reduced little or not at all by FIT every two years (relative risk 0.95)
- FIT every year may achieve a small reduction (relative risk 0.85)
- May be reduced by a single sigmoidoscopy (relative risk 0.73)
- May be reduced by a single colonoscopy (relative risk 0.66)
There was no clinically relevant difference in all-cause mortality when comparing screening with no screening, or between the different screening options.”
2019.10.24
“I’m confident that many countries will be able to increase their overall output of food and all other products in the decades ahead while using fewer metals, minerals, fertilizer, water, cropland, trees, fossil fuels, and other resources of the earth. I’m confident because America is already doing so.
The US, which accounts for about 25 percent of the global economy, consumes more material goods year after year, yet continues to decrease consumption of the resources listed above. What’s more, the country’s use of both electricity and energy in general has been essentially flat for the past decade.
How did the US start getting more from less? By using the tools of the digital age—hardware, software, and networks—to progressively dematerialize our consumption. In other words, we kept finding ways to use fewer atoms by using more bits.
Aluminum cans are more than 75 percent lighter than they were a few decades ago as engineers have used computer-aided design to make them lighter without sacrificing strength. Precision agriculture, aided by lots of sensors and computation, lets farmers selectively apply small amounts of water, fertilizer, and pesticide where needed instead of blanketing entire fields. Of the 15 devices featured in a 1991 Radio Shack ad, 13 have now vanished into the smartphone. Thanks to our smartphones, we now also buy many fewer compact discs, atlases, rolls of film, videotapes, and many other media.
Examples like these can be found all over the economy. Their cumulative impact is a sea change in our relationship with our planet. We used to increase our prosperity by taking more from the earth year after year. Now we know that we can grow and flourish while taking less.
More importantly, we need to stop devoting time and effort to planning for future research shortages. In a world where abundance and dematerialization are both increasing, this makes no sense. It makes great sense, however, to work on the challenges that capitalism and tech progress don’t solve on their own. These include reducing pollution, especially greenhouse gas pollution; protecting threatened species and lands; and bringing back opportunity to communities that have been left behind as capitalism and tech progress race ahead. All of these urgently require our attention now and in the years ahead. But we don’t need to worry that we’re going to run out—or run short of—critical resources in the decades to come. There’ll be plenty for everyone.”
Technology Will Keep Us From Running Out of Stuff
“Methods: We used data on six US population-based cohorts included in the NHLBI Pooled CohortStudy. We restricted the sample to participants with valid spirometry at two or moreexams. Two cohorts recruited younger adults (≥17 years), two recruited middle-agedand older adults (≥45 years), and two recruited only elderly adults (≥65 years) withexaminations done between 1983 and 2014. FEV 1 decline in sustained former smokers and current smokers was compared to that of never-smokersby use of mixed models adjusted for sociodemographic and anthropometric factors. Differential FEV 1 decline was also evaluated according to duration of smoking cessation and cumulative(number of pack-years) and current (number of cigarettes per day) cigarette consumption.
Findings: 25,352 participants (ages 17–93 years) completed 70,228 valid spirometry exams. Over a median follow-up of 7 years (IQR 3–20), FEV 1 decline at the median age (57 years) was 31·01 mL per year (95% CI 30·66–31·37) insustained never-smokers, 34·97 mL per year (34·36–35·57) in former smokers, and 39·92mL per year (38·92–40·92) in current smokers. With adjustment, former smokers showedan accelerated FEV 1 decline of 1·82 mL per year (95% CI 1·24–2·40) compared to never-smokers, which wasapproximately 20% of the effect estimate for current smokers (9·21 mL per year; 95%CI 8·35–10·08). Compared to never-smokers, accelerated FEV 1 decline was observed in former smokers for decades after smoking cessation and incurrent smokers with low cumulative cigarette consumption (<10 pack-years). With respectto current cigarette consumption, the effect estimate for FEV 1 decline in current smokers consuming less than five cigarettes per day (7·65 mL peryear; 95% CI 6·21–9·09) was 68% of that in current smokers consuming 30 or more cigarettesper day (11·24 mL per year; 9·86–12·62), and around five times greater than in formersmokers (1·57 mL per year; 1·00–2·14). Among participants without prevalent lung disease,associations were attenuated but were consistent with the main results.
Interpretation: Former smokers and low-intensity current smokers have accelerated lung function declinecompared with never-smokers. These results suggest that all levels of smoking exposureare likely to be associated with lasting and progressive lung damage.”
“Although a large majority of patient care in the United States occurs in the ambulatory care setting, most studies around patient safety have focused on the inpatient setting. This Deep Dive summarizes ECRI Institute PSO’s analysis of more than 4,300 events submitted to the event report database between December 2017 and November 2018 by ambulatory care facilities in three settings (ambulatory care centers, community health centers, and physician practices), with a focus on diagnostic testing errors, medication safety events, falls, and security and safety, and offers recommendations for how to mitigate the risks associated with these events.”
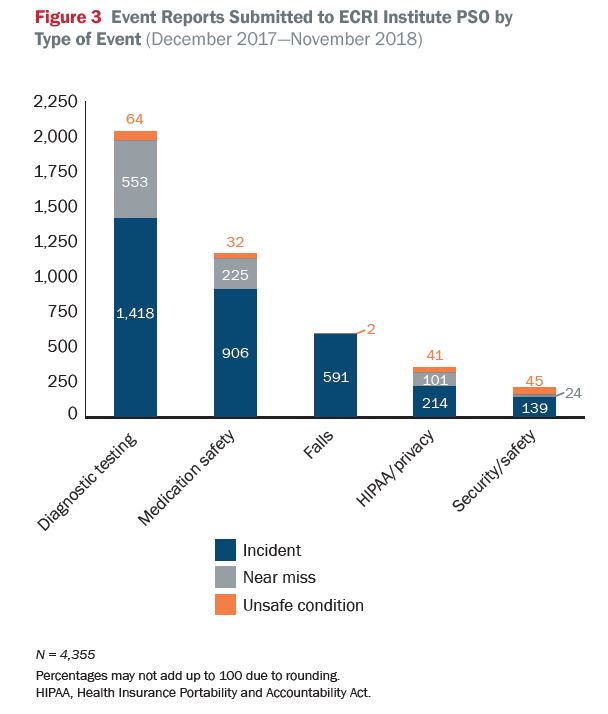
Safe Ambulatory Care Strategies for Patient Safety & Risk Reduction by ECRI Institute PSO
“Recognizing that risk is heightened when treatment is provided outside the standard of care, many physicians and patients simply avoid such circumstances. But without daring innovators, disruptive thinkers, and voluntary patient pioneers, little medical progress could be made.
[..] we perceive greater risk in acts of commission than in acts of omission: if a patient dies during or after transplantation, it’s the doctor’s responsibility; if the patient dies from organ failure while awaiting a transplant, we can blame the indifference of the universe. In recent years, I’ve asked my staff to consider our responsibility for our patients who die on the transplant waiting list; I believe those patients should be accounted for in decisions about the risk we’re willing to accept for the next patient.
Over the past decade, the Centers for Medicare and Medicaid Services has made these choices more complicated by certifying transplant programs on the basis of 1-year patient and organ survival. This quality measurement has introduced a new pressure: physicians’ willingness to provide innovative therapy not only affects their own risk profiles but also potentially places their programs and hospitals in jeopardy. I believe that the resulting increase in risk aversion has contributed to a shift in the research portfolios of many transplant programs, away from discovery research and toward health services science and clinical outcomes studies. This shift sets the field on a pathway that will have consequences for at least a generation.”
Excerpt – most of us probably know there is something in the way we move, and that that something defines us. In studies and daily life, most people can pick out their friends and loved ones, based solely on how they walk. At least one surveillance company also claims to be able to identify and track people using their gaits.
But those identifications, whether fond or creepy, rely on external cues about how we look in motion and depend on anatomical features, such as height, limb length or how we swing our arms, which may not be stable. Wear heels, develop sore feet, limp, and you could move differently.
Some scientists have speculated that other subtler, interior movement patterns, such as the ways in which our muscles fire in choreography with one another when we will our body to move, might be particular to each of us and relatively constant. But little research had delved into what our muscles are up to when we move.
“understanding how movement is controlled remains one of the main challenges for many scientific fields.” Our simplest-seeming moves are bogglingly complex. “A 5-year-old child can manipulate objects with superior dexterity to any robot,” he [François Hug, a professor of movement science at the University of Nantes] says.
So, quantifying the unique ways in which people walk, pedal or hold a glass could enable scientists to improve and refine robotics, prosthetics, physical therapy and personalized exercise programs.
[..] Movement signatures also might serve as coal-mine canaries for disease or injury risk, he says. He and his colleagues already are studying the relationships between certain muscle-activation patterns and Achilles’ tendon problems.
[..] Scientists do not yet know how permanent movement signatures are; if and how they alter with age, weight change or lifestyle; or if it ever will be feasible and affordable for most of us to learn our particular movement signature.
[..] “Differences in the way people move and respond to an intervention are often ignored,” he says, but they matter “for addressing fundamental questions about health, aging and disease.”