2020.9.29
“Annually, about 10 million people develop TB, and an estimated 1.5 million die from their disease, which makes it the leading infectious killer worldwide, even in the time of COVID-19.
[..] Key factors can significantly increase an individual’s risk. In particular, 2.3 million cases of TB were worldwide attributable to undernutrition in 2018: That’s one in five cases. By comparison, 1.2 million cases were attributable to HIV and 0.8 million cases to diabetes—risk factors that receive considerably more attention and funding. Undernutrition blunts the function of the immune system and increases the risk for TB so much so that it is likened to HIV/AIDS and called “nutritionally acquired immunodeficiency syndrome” or N-AIDS. Undernourished patients with TB get sicker, have more extensive lung damage, and are more likely to die from TB.
[..] Based on modeling studies, feeding an undernourished individual and increasing their body mass index (BMI) from 16 to 20 would decrease their risk for TB disease by about 50 percent. This would be as beneficial as the new TB vaccine, which is generating great enthusiasm. Of course, feeding people has benefits beyond mitigating TB risk: prevention of complications from vitamin and mineral deficiencies, protection against other infectious diseases, increased economic productivity, and decreased human suffering due to hunger.”
Meals As Medicine: Feed The Hungry To Treat The Tuberculosis Pandemic, Sinha P and Hochberg NS. Health Affairs Blog 2020.9.29
[Health Information Technology] “Technology-enabled eHealth programs represent potentially cost-efficient and practical means for customized PA [physical activity] guidance to diverse groups. Most people targeted by eHealth, however, are well educated, younger than 50 years, and of non-Hispanic White ancestry, potentially intensifying health disparities.
[..] This investigation tested whether a virtual advisor could increase 12-month walking to an extent similar to a comparably structured human advisor program among Latino adults. The human advisor program was delivered by trained peer advisors—a resource-efficient approach that is well accepted by Latino and other diverse groups but may be less convenient and scalable than computer-based programs. [..] Both interventions were considered “light-touch” given that they were delivered using primarily non–health professional staff and resources.
[..] COMPASS (Computerized Physical Activity Support for Seniors) was a single-blind, cluster-randomized noninferiority parallel trial10 conducted by Stanford University and Northeastern University. [..] They received a $10 gift card/assessment. Such modest remunerations have been found to have minimal influence on PA change.
Participants were recruited from community centers in Santa Clara and San Mateo counties, California. The centers were randomized in pairs (1:1 allocation) based on locale to either virtual or human advisors based on a computerized randomization sequence. [..] Both arms received a similar 12-month behavioral PA instruction/support program at their designated center based on Active Choices—an individually tailored program with demonstrated effectiveness and translatability that has merited formal recognition by the Administration on Aging, National Council on Aging, and the Centers for Disease Control and Prevention.
[..] The following eligibility criteria were used13: (1) age 50 years or older; (2) insufficiently active (ie, engaged in <100 min/wk of moderate-intensity PA over the past month, based on the Community Healthy Activities Model Program for Seniors [CHAMPS] instrument); (3) able to safely engage in moderate-intensity PA, such as walking, based on the PA Readiness Questionnaire; (4) live less than 5 miles from a study-designated community center; (5) be able to read and understand English or Spanish sufficiently to provide informed consent and participate in study procedures, including computer use; and (6) plan to live in the area for a year.
[After an introductory session,] Participants then received up to 28 brief (10-15 minutes) advising sessions across 12 months. Sessions followed a standard, evidence-based protocol and allowed for customization based on participant preferences and availability. Each session consisted of an introductory dialogue, brief check for health changes, review of pedometer steps and minutes walked since last session, problem-solving around personal PA barriers, goal-setting, and next-session scheduling. Cultural tailoring occurred in a variety of ways.
The virtual advisor, described elsewhere, was an interactive, animated computer agent simulating face-to-face counseling using simple speech (synthetic English or Spanish) and nonverbal behaviors (eg, facial cues and hand gestures). The virtual agent, named Carmen, was successful previously in increasing 4-month walking levels among Latino aging adults relative to controls. Individuals interacted with Carmen by touching simple conversation boxes on the computer screen offered in English and Spanish and targeted at a first- to third-grade reading level. Participants received a private log-in and were encouraged to wear headphones for privacy. They also were encouraged to download their pedometer data on the virtual computer at each session via a USB port. One difference between this system and some other automated health information systems is that participants could interact directly with this system at their convenience, receiving real-time customized advice through the multi-modality visual plus auditory interface.
[..] Change in walking minutes per week was assessed using the 4 walking items from the validated CHAMPS survey (interview format) for older adults, which is available in English and Spanish. Such standardized self-report instruments represent the most direct, reliable, and cost-efficient means for assessing specific PA types typically targeted in community interventions, given that device-based assessment tools (accelerometers) capture more general movement beyond such purposeful PA behavior and currently lack sufficient normative data, especially among older adults, to allow direct linkages with the PA guidelines and evidence base.
[..] A total of 241 participants (98.4%) were Latino, 193 participants were women (78.8%), and 52 participants were men (21.2%). Mean (SD) age was 62.3 (8.4) years (range, 50-87 years). One hundred seven participants (43.7%) had an education level of high school or lower. Mean (SD) years of residence in the US was 47.4 (17.0) years. Mean (SD) BMI was 32.8 (6.8), with 156 participants (63.7%) in the obese range. One hundred nineteen participants (48.6%) were taking antihypertensive medications. Reported walking time was low (mean [SD] total, 70 [98] min/wk; approximately 10-minute/d). Baseline accelerometry-derived MVPA [moderate to vigorous physical activity] per week also was low (mean [SD] virtual advisor, 40.7 [25.8]; human advisor, 43.6 [31.2]). One hundred six participants (43.3%) chose to receive their intervention in Spanish (virtual advisor, 48 [39.0%]; human advisor, 58 [47.5%]) (χ2 = 1.81, P = .18).
The mean (SD) number of total advising sessions completed for virtual vs human advisors was 18.8 (11.8) (64.8%) vs 18.4 (8.9) (63.4%) (t test, 0.30; P = .76). Mean length of postintroductory advising sessions was significantly shorter in virtual (8.4 [4.8] min/session) vs human (21.0 [7.1] min/session) (t test, 16.0, P < .001). This finding translates into a mean total intervention volume for virtual vs human of 3.2 hours (56.6) vs 6.9 hours (63.0) (t test, 27.8; P < .001). Although both programs encouraged pedometer use and reporting at each session, pedometer reporting was sporadic in both programs across 12 months (eg, month 12 reporting for virtual advisor, 35.8% vs human advisor, 32.8%; χ2 = 0.24; P = .62).
Twelve-month change in walking minutes per week [..] supported noninferiority (ie, lower limit of the 95% CI [−20.6] lay to the right of the noninferiority margin [−30]). Mean walking increases indicated a somewhat larger increase in the virtual advisor cohort (153.9 min/wk; 95% CI, 126.3 min/wk to infinity vs 131.9 min/wk; 95% CI, 101.4 min/wk to infinity; difference, 22.0, with lower limit of 1-sided 95% CI, −20.6 to infinity). Similar results were obtained using per-protocol analyses (mean [SD] increases in walking time for the virtual advisor cohort [n = 117]: 158.6 [217.1] min/wk vs human advisor cohort [n = 114]: 134.8 [192.1] min/wk; P = .02). At baseline, no participant was at the nationally recommended target range of 150 min/wk or more of MVPA; at 12 months, 29.3% of the virtual advisor and 31.1% of the human advisor cohorts achieved that target (χ2 = 0.10, P = .75).
[..] Both arms reported improvements in overall well-being, with the magnitude of the within-arm improvement somewhat larger in the human advisor (mean [SE] change, 3.5 [0.6]; t = 4.1; P < .001) compared with the virtual advisor (mean [SE] change, 1.1 [0.6]; t = 1.8; P = .06) cohorts. The human advisor cohort reported significant pre-post improvements in all 10 domains (eg, good appetite and few aches or pain), while the virtual advisor cohort reported significant improvements in 3 domains (sleep well, feel rested, and full of pep and energy).
[..] The results of the present trial expand the small PA eHealth evidence base for older adults and Latino populations across longer time frames. Both programs also produced reported decreases in prevalent sedentary behaviors, including television/video viewing, that have been linked independently with detrimental health outcomes.”
Effects of Counseling by Peer Human Advisors vs Computers to Increase Walking in Underserved Populations: The COMPASS Randomized Clinical Trial, King AC, Campero MI, Sheats JL et al. JAMA Internal Medicine 2020.9.28
[Clinical Pearl] “Intermittent fasting (IF) has gained attention as a simple weight loss method. Intermittent fasting refers to eating windows separated by defined periods of fasting (>12 hours and up to 48 hours, or more). Most of the reported benefits of IF are either untested or undertested in humans. Time-restricted eating (TRE) is a specific IF protocol involving consistent fasting and eating periods within a 24-hour cycle. [..] We conducted a randomized clinical trial (RCT) designed to determine the effect of TRE on weight and comprehensive metabolic outcomes in overweight and obese patients. We hypothesized that 8-hour TRE prescribed to individuals with overweight and obesity would lead to weight loss and improvements in metabolic markers compared with individuals following a standard 3-meals-per-day diet (consistent meal timing [CMT]).
[..] Participants received study surveys through the study app. Participants were given a bluetooth weight scale to use daily, which was connected through the study app. Participants were randomized to 1 of 2 interventions. The study intervention only included recommendations to the timing of food intake (no recommendation for calorie and macronutrient intake or physical activity), and participants received daily reminders about their eating windows through the app. The CMT group was instructed to eat 3 structured meals per day. Snacking between meals was permitted. The TRE group was instructed to eat ad libitum from 12:00 pm until 8:00 pm and completely abstain from caloric intake from 8:00 pm until 12:00 pm the following day (16 hours fast:8 hours eat). Only noncaloric beverages were permitted outside of the eating widow. Participants provided consent through the app, and received a $50 Visa gift card for participating in the study.
[..] Of the 141 participants who were randomized to 1 of the 2 interventions, 105 (74.5%) completed the entire 12-week intervention. [..] Self-reported adherence to the diets was 1002 of 1088 (92.1%) in the CMT group (did not miss any meals) and 1128 of 1351 (83.50%) in the TRE group (ate only within the 8-hour window).
[..] There was a significant decrease in weight in the TRE group (−0.94 kg; 95% CI, −1.68 kg to −0.20 kg) and a nonsignificant decrease in weight in the CMT group (−0.68 kg; 95% CI, −1.41 kg to 0.05 kg). Importantly, there was no significant difference in weight change between groups (−0.26 kg; 95% CI, −1.30 kg to 0.78 kg).
[..] As measured by dual-energy x-ray absorptiometry (DXA), there was no significant change in whole body fat mass (FM) in the TRE (−0.51 kg; 95% CI, −1.17 kg to 0.15 kg) or the CMT groups (−0.03 kg; 95% CI, −0.66 kg to 0.60 kg). [..] There was a significant decrease in lean mass (calculated as fat-free mass minus bone mineral content) in the TRE (−1.10 kg; 95% CI, −1.73 kg to −0.48 kg) but not in the CMT group (−0.35 kg; 95% CI, −0.95 kg to 0.25 kg). There was no significant difference in lean mass between groups (−0.75 kg; 99.7% CI, −1.96 kg to 0.45 kg).
[..] There were no significant within-group or between-group differences in fasting glucose, fasting insulin, HOMA-IR, HbA1C, triglycerides, total cholesterol, LDL, or HDL levels. [..] There was no significant difference in systolic blood pressure in the TRE group (−1.69 mm Hg; 95% CI, −5.54 mm Hg to 2.15 mm Hg), but there was a significant decrease in the CMT group (−3.86 mm Hg; 95% CI, −7.58 mm Hg to 0.14 mm Hg). There was no significant between-group difference in systolic blood pressure (2.17 mm Hg; 95% CI, −3.18 mm Hg to 7.52 mm Hg).
[..] Together, the results of this study (1) do not support the efficacy of TRE for weight loss, (2) highlight the importance of control interventions, and (3) offer caution about the potential effects of TRE on ALM. Future studies should be aimed at understanding the effects of early vs late TRE and protein intake or timing as a means to offset the loss in ALM [appendicular lean mass].”
Effects of Time-Restricted Eating on Weight Loss and Other Metabolic Parameters in Women and Men With Overweight and Obesity: The TREAT Randomized Clinical Trial, Lowe DA, Wu N, Rohdin-Bibby L et al. JAMA Internal Medicine 2020.9.28
[Health Technology] “Reporting of adverse events to the US Food and Drug Administration (FDA) has long been the primary mechanism of identifying safety issues with medical devices—ranging from nasal swabs to cardiac defibrillators to in vitro diagnostic test kits. Each day, approximately 3500 adverse event reports are collected in the agency’s Manufacturer and User Facility Device Experience (MAUDE) database. As anyone who has tried to use it will attest, the database provides a difficult-to-use interface to search these reports.
[..] The agency’s Sentinel System has successfully identified issues with drugs using a combination of claims and electronic health record data, but unlike MAUDE, the Sentinel System data are not publicly available, and the wait time for data requests can be several months. Drug-related adverse events are easier to link to Sentinel System data because of the National Drug Code, which uniquely identifies a drug so it can be linked directly to the report. In 2019, less than 2% of the 1.3 million adverse event reports for devices contained a Unique Device Identifier (UDI), and the UDI is often redacted by the FDA in whole or in part because the agency’s Freedom of Information Act team is unsure of which portions of the UDI are protected health information, even though only the serial number should be redacted. This redaction is important because all other methods of postmarket surveillance for medical devices in development by government agencies, hospitals, device registries, and insurance companies rely on the UDI. In addition, until all devices contain a UDI, the use of the Sentinel System for medical device surveillance is not feasible.
[..] The FDA should require immediately (and enforce) the listing of the UDI on every adverse event report and discontinue all redactions of the identifier to decrease chances that patients are not unknowingly receiving harmful devices.
The FDA could also improve medical device reporting by requiring that physicians submit reports directly to the FDA instead of the current system in which almost all these reports are first submitted to the manufacturer (often to get a replacement device or report an event). Under current law, only hospitals and manufacturers, not physicians, are mandated to report to the FDA. The Medical Device Guardians Act, a bipartisan bill introduced in the US House of Representatives in 2019, would provide the FDA with a mechanism to require that physicians report adverse events directly to the agency. Direct reporting with the UDI would greatly speed the time to identify signals and improve the chances that all the relevant details of the event are submitted. A copy of the report could be sent to the manufacturer simultaneously.
Data from the MAUDE database can be improved on, and even more can be done without waiting for the components of National Evaluation System for Health Technology to be implemented. For example, the FDA should reinstate the acceptance of adverse events via the Medwatcher, a third-party iPhone and Android application that allows submission of adverse events directly via smartphone and facilitates reporting by patients and physicians.”
Identification and Market Removal of Risky Medical Devices, Tomes M. JAMA Internal Medicine 2020.9.28
2020.9.28
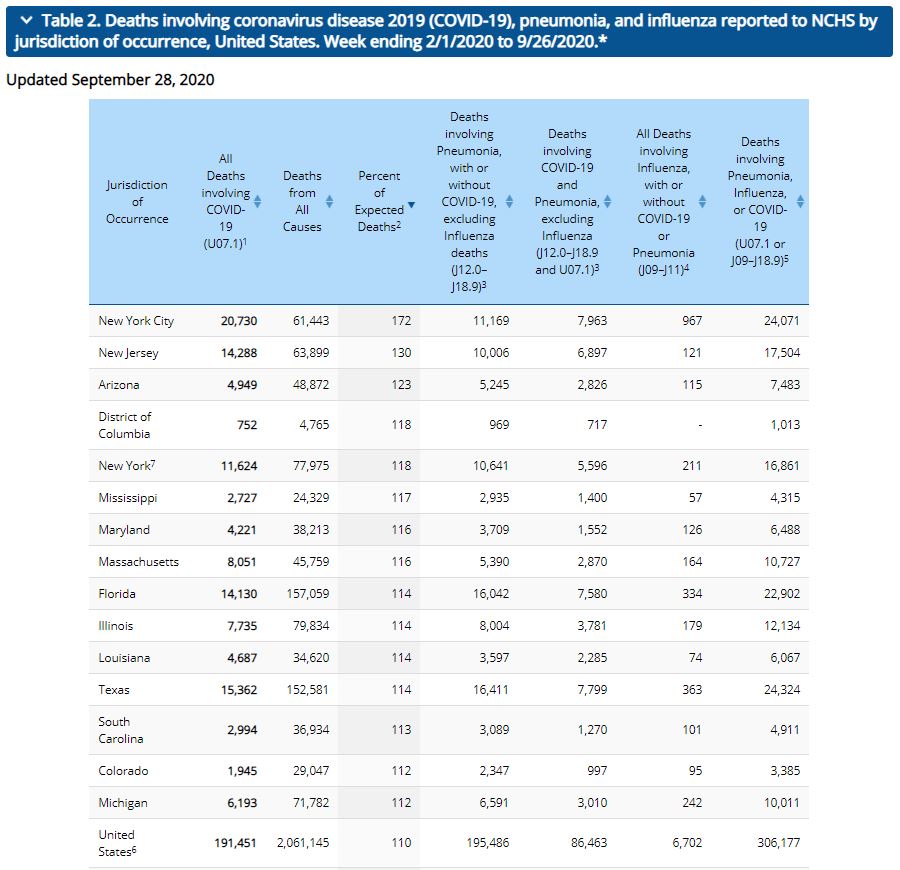
[COVID-19] The CDC updated its count of excess deaths by state earlier today. For the weeks between the week ending February 1st through the week ending September 26th, the national excess death rate was 110% (same as last week). Thirteen states, the District of Columbia and New York City are reporting excess death rates higher than the national average (same as last week). Georgia has an excess mortality rate of 110%. California, Georgia and Nevada all had an excess mortality rates of 110%.
New York City has the highest excess mortality rate (172% [down three percent]), followed by New Jersey (130% [down three percent]) and Arizona (123% [no change]).
[High-value Care] “Managing health care spending is critical considering that the U.S. health care economy exceeds $3.5 trillion. Between $760 billion and $935 billion is wasted on low-value care that costs considerably more than its clinical benefits are worth.
Giving Equal Weight to Valuation of Health Care Services and Technologies
[..] payer reimbursements for health care providers and biomedical manufacturers could not be more different. Medicare and other payers that adhere to Medicare payment structures use prospective payments based on diagnosis-related group for hospital services, and fee schedules based on relative value units for physician services. Payments have created a fundamental divide in Maryland and elsewhere, in that service costs are regulated but prices of biomedical interventions have increased in defense of supporting innovation. [..] A governing body that uses economic evaluation without discriminating between services and biomedical interventions stands to reduce wasteful spending across health systems.
Opportunity Costs
[..] Opportunity costs describe forgone benefits relating to the next best option when financial resources are committed to a particular activity. For example, spending resources on costly health care services, procedures, or pharmaceuticals can withdraw finances from other priorities, such as primary and preventive care.
[..] Overall, opportunity costs need to be considered in balance with health care benefits. Economic evaluation can identify decisions that maximize benefits and control costs—for example, establishing “cost-effectiveness thresholds” that represent the maximum a system can spend on health care before its benefits are outweighed by its opportunity costs.
Resource Prioritization With Value of Information [VOI]
[..] If applied effectively, VOI would move the United States ahead of other countries that use economic evaluation by enabling educated decisions about future research investments that lead to new innovations or more efficient resource allocation for patients who need targeted therapies. Research prioritization based on empirical methods would be a commonsensical way to allocate funding.
[..] VOI has not gained traction in the United States for several reasons. First, it does not always align with special interests that may aim to perform new trials in areas that offer little incremental value to the wealth of information. Second, it is linked to cost-effectiveness analysis, models, and thresholds, which have themselves been slow to become established. However, VOI can be used outside economic evaluation, as work funded by the Patient-Centered Outcomes Research Institute has shown.
The QALY
[..] The QALY expresses health status as a function of impacts on quality of life, including physical and mental components, and on survival and life expectancy. Limitations of QALYs are widely understood, including lack of sensitivity to some important changes in health and strong assumptions about inapplicable individual preferences. However, QALYs offer a well-understood, durable, and easily applied measure to inform resource allocation.
Addressing No-Value Care
[..] In the absence of an empirically evidenced threshold, there remain many low-value services and biomedical interventions that could be phased out. In particular, dominated interventions (“no-value care”) that increase costs but do not improve benefits are low-value options that do not need a threshold for decision makers to agree that they should be phased out. For example, a recent study identifying that individualized glycemic control for type 2 diabetes reduced costs and increased QALYs across several sociodemographic strata provided justification for phasing out outdated practices of uniform intensive glycemic control. In these situations, economic evaluation could reduce the availability of treatments that increase costs at reduced health benefit compared with more affordable alternatives, as well as protect these treatments for certain individuals who could still gain exceptional health benefit (such as minority populations).
State-Level Agreement on Value
[..] If the relative values of services and biomedical interventions are analyzed using economic evaluation, then opportunity costs, and hence cost-effectiveness thresholds, would vary greatly between states on the basis of high-cost health care decisions. For example, New York Medicaid’s formulary rejection of lumacaftor/ivacaftor (Orkambi [Vertex Pharmaceuticals]) for cystic fibrosis at the list price, in reference to ICER’s economic evaluation, implied that the product’s benefits were insufficient to justify the opportunity costs imposed on other patients at the acquisition price sought by the manufacturer. Alternatively, statewide policy in Louisiana to cover hepatitis C treatment for Medicaid beneficiaries may generate sufficient health benefits to justify opportunity costs imposed on others. However, for Mississippi, providing the same coverage for hepatitis C could come at such a high opportunity cost that it could not be justified on grounds of efficiency or equity. Therefore, the issue of redistribution of spending on health care and public health between states would follow.
[..] First, the United States could use economic evaluation only to phase out no-value care options. Second, it could establish a universal cost-effectiveness threshold at the level of the wealthiest or poorest state, with varying consequences: A threshold too high or too low could affect opportunity costs for some states. Third, cost-effectiveness thresholds could vary by state or clusters of states with similar levels of affordability (for example, quartiles). With the latter option, clusters could also organize value assessment commissions like Maryland did to make local decisions and spare separate states the duplication of effort. In addition, federal oversight of state processes could prevent situations where local-level decisions negatively affect persons in other places.
Finding a Collective Purpose for Economic Evaluation
[..] Health care in the United States is made up of fragmented payers, health systems, and innovators that do not have to play by similar rules. This is highly contrasted to other nations like England, where decisions by the National Institute for Health and Care Excellence are linked to economic evaluation to recommend coverage decisions. The fact that the National Health Service and National Institute for Health and Care Excellence serve the same patients means that they have a collective purpose in England—to ensure that these patients have access to high-value care.
[..] The United States may be far off from adopting a single-payer system; however, short-term goals exist that could serve a collective purpose for economic evaluation. For instance, Medicare lacks a formulary to inform provider patterns of prescribing and ordering. If Medicare organized governance in value assessment to inform formulary-based decisions about coverage, then it would use taxpayer dollars to ensure that resources are allocated equitably among all beneficiaries.
[..] Likewise, if other payers and providers could begin to adopt the same rules of value through a central body like Medicare might do, then the collective purpose would spread while protecting the individuality of coverage plans and health systems. Some payers have indicated that they are already prepared to use economic evaluation in coverage decisions; for example, CVS Caremark announced that it would partner with ICER on economic evaluations assessed at a $100 000-per-QALY threshold. However, others lack transparency on how their benefit plans are structured. Meaningful use of economic evaluation among all stakeholders in health care delivery can happen only when the playing field is level and, as the previous point implies, when states offer important financial structure on which these institutions can model their economic evaluation.
Political Discourse for Economic Evaluation
[..] distributional cost-effectiveness analysis has been developed and applied to reflect the distribution of health outcomes across populations, and extended cost-effectiveness analysis has sought to incorporate concerns about financial risk protection to certain groups or individuals. Nonetheless, in order for economic evaluation to gain bipartisan support, liberals would have to compromise with conservatives on some other interests to introduce value assessment governance through federal legislation.
Perhaps for this reason, states may be best suited to address value locally. However, the single largest payer remains a federally funded one—Medicare—and the United States spends an average of more than $10 000 per capita on health care. Spending levels are astronomical, so there is no better time than now to introduce legislation that expresses a need for the United States to follow more economical practices in the allocation of health care resources. With U.S.-based organizations, such as ICER, prepared to handle some demand for economic evaluation, the United States could efficiently transition to more economical approaches for delivering health care.”
Ideas About Resourcing Health Care in the United States: Can Economic Evaluation Achieve Meaningful Use? Padula WV and Sculpher MJ. Annals of Internal Medicine 2020.9.29
[Drug Pricing] “The authors [Emanuel EJ et al. in a JAMA Internal Medicine Special Communication also published today] suggest that the United States should learn from its peers, from other developed nations that have created publicly accountable institutions for health technology assessment and drug price determination and that have reaped a return in the form of prices that are lower and better aligned with clinical value than drug prices in the United States.
[..] Payers in the United States (governmental programs, self-insured employers, insurers, pharmacy benefit managers) conduct their own implicit health technology assessments but usually without the transparency or evidence focus of the peer nations studied by Emanuel et al. [i.e., Australia, France, Germany, Norway, Switzerland, and the United Kingdom] [..] A review of coverage policies from the largest 17 private payers in the United States reported that only 15% of 4811 coverage policies had cited the same study evaluating a specific drug for a specific indication. US payers should be required to conduct their assessments in a transparent manner, with public proceedings and published findings, and give a clear evidence-based rationale for formulary exclusions and prior authorization requirements. Patient advocacy organizations and professional societies should have an opportunity to review and comment. Mandated transparency would push US payers toward standardizing their methods, as is occurring in Europe.
[..] There are 2 problems with the prevalent strategy for price negotiations in the United States. First, the interests of the payers are only imperfectly aligned with those of patients, employers, and taxpayers. Rebates are negotiated in strict confidence as are coverage and prior authorization decisions. Payers often favor high-price and high-rebate drugs over therapeutically similar low-price and low-rebate drugs because payers can retain a significant share of the rebates rather than pass them through to the patients, employers, and governmental programs.
Second, the method used by US payers to move from health technology assessment to price discounts imposes huge transaction costs on the system. Payers have numerous employees who create administrative restrictions on the ability of physicians to prescribe. These administrative access barriers are supplemented with onerous financial access barriers, including coinsurance and deductibles. In their turn, pharmaceutical firms have numerous employees who interact with physicians and who support patients, and thereby enhance sales revenues. Payers then further tighten administrative restrictions and increase cost sharing, leading the pharmaceutical industry to further increase its expenditures on marketing and patient support.
[..] One of the most admirable features of other developed nations, although not emphasized in the article by Emanuel and coauthors, is that these countries proceed from value assessment to price discount with much less bureaucratic involvement. The German system, for example, has a single national formulary that covers all drugs authorized by the European Medicines Agency, does not allow insurers to impose prior authorization on patients, and limits consumer cost sharing to a maximum of €10 per prescription (waived for children and patients with chronic illnesses).
The German system of drug assessment and price determination is of particular relevance to the United States because it relies on a system of multiple competing health insurance firms rather than the single public payer found in many other nations. German insurers must cover every innovative drug as soon as authorized by the European Medicines Agency and, in the first year after launch, pay the manufacturer’s full list price. During that first year, the semipublic Joint Federal Committee conducts a clinical assessment of the new drug in comparison to others that treat similar indications. This health technology assessment report is passed on to the association of insurers, which negotiates a price with the manufacturer based on the price of the comparator drug, the incremental benefit of the new drug, and the prices charged in other European nations (although in practice many novel drugs are launched first in Germany). All insurers then pay the same price for the new drug.7 Manufacturers are not permitted subsequently to increase the price of their drugs without submitting new evidence of clinical benefit and going through a new set of negotiations with the insurer association. The German approach has resulted in substantially lower drug prices than those paid in the United States both by private insurers and Medicare.
[..] Compared with the purchasing structures in the 6 countries described by Emanuel et al, purchasing pharmaceuticals in the United States is fragmented, unsophisticated, opaque, beset with conflicts of interest, and not surprisingly, ineffective. Prices are higher in the United States than in other nations of comparable income. There is no consistent alignment between drug prices and clinical value. Insurance coverage policies are not based on scientific evidence in a consistent and transparent manner. Physicians’ prescriptions are frequently rejected based on financial grounds. High cost sharing burdens many patients with severe illness and adds to already serious failures of prescription adherence.
It does not have to be like this. Other nations are more efficient in their purchasing processes, more effective in their outcomes, and more ethical in how they treat patients with respect to drug pricing. The United States has much to learn.”
Sophisticated Purchasing of Pharmaceuticals: Learning From Other Countries, Robinson JC. JAMA 2020.9.28
[Interesting] “[physician and health reporter James] Hamblin’s new book, Clean: The New Science of Skin, is a documentary survey of this pre-dawn moment in our understanding of the skin microbiome.
[Emily Vaughn] Your book sets out to challenge some cultural norms about hygiene. What types of cleansing do you think are overdue for reexamination, and which are critical?
[James Hamblin] There’s a distinction between “hygiene” and “cleansing rituals” that’s especially important in this moment. “Hygiene” is the more scientific or public health term, where you’re really talking about disease avoidance or disease prevention behaviors. Removal of mucus, vomit, blood feces … any behavior that signals to people “I am thoughtful about not transmitting diseases to you, and I’m a safe person to be around.” That would include hand-washing, brushing your teeth, cleaning of open wounds, even mask-wearing. I don’t think any of that stuff is due for questioning.
But a lot of the other things that we do are class and wealth signifiers — like combing your hair or whitening your teeth or wearing deodorant — which actually have nothing to do with disease avoidance or disease transmission. They’re really much more of a personal or cultural preference. And that’s where people are experimenting with doing less.
[Emily Vaughn] Why do you think that some of these cultural practices deserve to be reexamined?
[James Hamblin] So many reasons. We’re spending a lot of money (or at least we were pre-pandemic, I don’t have new data) on products and practices in this enormous industry-complex of self-care, skin care, hygiene and cosmetics — which is barely regulated, which is a huge and important part of people’s daily lives, which people worry a lot about, which people get a lot of joy from, which people bond over, which people judge, and which causes a lot environmental impacts in terms of water and plastic.
And there’s the emerging science of the skin microbiome. Being clean [has historically] meant removing microbes from ourselves, so it’s an important moment to try to clarify what, exactly, we’re trying to do when we’re doing the hygiene behaviors. [..]
[Emily Vaughn] You wrote that you think we’re at the edge of a radical reconception of what it means to be clean. What do you mean by that?
[James Hamblin] That’s harder to answer now because I don’t know how the current moment is going to change things. But I believe there’s a shift in the very near future upon us, similar to what we saw with the gut microbiome.
Twenty years ago, the idea of kombucha, and probiotics, and trying to have a healthy biome in your gut were really fringe hippie concepts. And now we’re doing clinical trials of fecal transplants. It’s very mainstream to think about your microbiome. People are being more conscious about things like antibiotic overuse because they don’t want to potentially disrupt the gut microbiome. That has been a really radical shift.
And something like that [for] the skin would be even more radical in terms of the effect on our daily lives, and consumer behaviors and spending, because a lot of what has been done traditionally [in terms of hygiene] is predicated on eradicating microbes. [..]
[Emily Vaughn] What’s the danger of that fine line [between drugs and beauty products here, which makes it very hard for consumers to know]?
[James Hamblin] Most likely these products are not doing anything. Because there’s so little regulatory oversight on this type of product, we don’t even know for sure that they contain what they claim to contain. And if they were significantly changing your skin microbes, I would want to be extremely careful that there was indeed evidence to back up that that change was good and worth making.
I think a lot of people buy products like this thinking, “It can’t hurt, right?” And I would suggest keeping in mind that if something can help, that it can hurt.”
In The Era Of Hygiene, ‘Clean’ Author Makes The Case For Showering Less, Vaughn E. Shots: Health News from NPR 2020.9.26
[Inequality] “Just as the Black Lives Matter movement has highlighted racial inequities in law enforcement, so the lopsided toll of Black victims in the pandemic has revealed them in health care. Hospital policing is where these two disparities collide. Cleveland’s prestigious hospitals, which mainly employ and treat whites, are surrounded by low-income Black neighborhoods with some of the worst health outcomes in Ohio, including lower life expectancy and high rates of asthma, diabetes and infant mortality.
Hospitals have replaced the factories and plants of a faded industrial era as the most important economic engine in northeast Ohio. The clinic [Cleveland Clinic] surpassed Walmart last year to become Ohio’s largest employer, with more than 50,000 employees. It is consistently ranked as one of the top three hospital systems in the country in both quality of care and size.
[..] Revenues for the clinic system [Cleveland Clinic], which also includes hospitals in two other states and three countries, were just over $10 billion in 2019. The presidential debate will take place in the Samson Pavilion, which features a massive steel roof and soaring 80-foot-high indoor courtyard. It’s the centerpiece of a half-billion-dollar health education campus that opened last year.
In many other cities, University Hospitals would be the biggest health care system. As it is, the UH system is the second-largest employer in northeast Ohio. Its 2018 revenues topped $4 billion. The hospitals are separated on Euclid by the campus of Case Western Reserve University, which has its own police force.
[..] Cleveland’s hospital zone may be one of the most heavily policed areas in the country. Besides the private police agencies, the city police patrol the area, as does the Greater Cleveland Regional Authority Transit Police Department. City police handle most of the major crimes in the area. Calls for help made from the hospital area through the 911 system still go to city police, although there are times when the city department will contact the private agencies for help. Still, the hospital police forces initiate most of their own arrests and citations, often prompted by a traffic stop, a call from hospital staff or someone acting suspicious.”
What Trump and Biden Should Debate at the Cleveland Clinic: Why the Hospital’s Private Police Mostly Arrest Black People, Armstrong D. ProPublica 2020.9.28
[Policy] “Trump’s plan is to ship seniors $200 prescription drug coupons in the coming weeks, a massive, $6.6 billion initiative that he announced less than six weeks before Election Day. He is relying on the same authority that Obama used in 2010 to bolster a more expensive, albeit less outwardly political, plan to direct bonus payments to high-performing insurance companies ahead of his own reelection campaign.
[..] Both the Obama and Trump controversies surround so-called demonstration authority, a power granted to the White House to test whether changes to Medicare to make the program run smoother or save money.
Obama used that authority to change the bonuses for high-performing insurers that contract with Medicare. The plan, which was meant to test whether “stronger financial incentives and investments” would lead plans to offer better quality insurance coverage, would have doled out lucrative bonuses to 90% of private insurers.
Republicans saw it as an attempt to insulate seniors from spiking insurance premiums before an election. They argued that the Obama administration was robbing money from a different health program to prop up the Affordable Care Act and doling out the bonuses to make sure seniors didn’t feel the brunt of the cuts before the election.
“An honest way to come to the Congress is: Look, we screwed up, we would destroy Medicare Advantage if we didn’t bail it out, so we came up with a scheme to bail it out, that’s what you did,” said Rep. Darrell Issa (R-Calif.), who led the Republican investigation into the project.
[..] Both the GAO [Government Accountability Office] and lawmakers noted that the absence of a control group made it difficult to conduct an experiment to measure the program’s effectiveness. The GAO ultimately found that the Obama administration likely exceeded its authority and recommended the demonstration be canceled.
“There was clearly oversight following that demonstration,” said Jon Blum, the former Obama administration official hauled before Congress after the Obama demonstration. Blum added that he believed many of the criticisms waged at the Obama demonstration, like the lack of a control group, likely could plague the Trump ploy, too.
Trump’s plan is more brazen. It’s not clear how the Trump administration might test whether the payments had their intended goal if all seniors in Medicare are getting payments — or what the administration is planning to test at all.”
Republicans blasted Obama’s use of an obscure Medicare law. Now Trump’s using it on $200 drug coupons — and the GOP is silent, Florko N and Facher L. Stat News 2020.9.25
2020.9.27
[COVID-19] Excerpt – Unless you are living with an infected person — in which case the Centers for Disease Control and Prevention offers specific guidelines to follow — protecting yourself at home does not require extraordinary measures, Dr. [Virginia Tech’s Linsey] Marr said. And when you venture elsewhere, wearing a face covering and washing your hands are still the best ways to protect yourself indoors.
Health experts offered several tips for dodging the virus indoors: Open the windows, buy an air filter — and forget the ultraviolet lights. Fear of the risk of transmission indoors has fueled a market for expensive devices that promise to scrub surfaces — and even the air — but most of those products are overkill and may even have unintended harmful consequences.
“Anything that sounds fancy and isn’t tried-and-true — those are all things to avoid,” said Delphine Farmer, an atmospheric chemist at Colorado State University in Fort Collins. “Soap and water work beautifully.”
Managers of larger buildings should encourage those who can to work from home and adopt strategies like adding air filters and disinfecting surfaces. Researchers at the Massachusetts Institute of Technology have created an app to determine how many people can safely congregate in a given space and for how long.
But regardless of these precautions, the optimal strategy is simply to wear a mask indoors, said Martin Bazant, a chemical engineer at M.I.T., adding, “That’s a much bigger effect than any of those strategies would provide.”
[..] Unlike portable air filters that are inexpensive and can simply be plugged into an electrical outlet, UV lights need to be carefully engineered by trained individuals in order to disinfect. Installed incorrectly, they can cause skin burns and damage eyesight, said Saskia Popescu, a hospital epidemiologist at the University of Arizona in Tucson.
UV lights are regulated mostly for use as pesticides and are not well studied for use around people, she added: “I get really nervous when I see people pushing UV disinfection.”
UV light generally does not penetrate deep into a surface and will not destroy virus that’s buried beneath other microscopic detritus.
[..] “Everybody is inundated right now with the shiny new solutions that are being sold to them,” Dr. [building safety expert at Harvard’s T.H. Chan School of Public Health Joseph] Allen said. “And the reality is, it’s a time for the basics.”
How to Keep the Coronavirus at Bay Indoors, Mandavilli A. New York Times, 2020.9.27
[Health Information Technology]”This systematic review identified and summarized EHR-integrated systems to remotely collect patient-reported symptoms and examined their anticipated and realized benefits in long-term conditions.
[Results] We included 12 studies representing 10 systems. Seven were in oncology. Systems were technically and functionally heterogeneous, with the majority being fully integrated (data viewable in the EHR). Half of the systems enabled regular symptom tracking between visits. We identified 3 symptom report-guided clinical workflows: Consultation-only (data used during consultation, n = 5), alert-based (real-time alerts for providers, n = 4) and patient-initiated visits (n = 1). Few author-described anticipated benefits, primarily to improve communication and resultant health outcomes, were realized based on the study results, and were only supported by evidence from early-stage qualitative studies. Studies were primarily feasibility and pilot studies of acceptable quality.
[Discussion/Conclusions] EHR-integrated remote symptom monitoring is possible, but there are few published efforts to inform development of these systems. Currently there is limited evidence that this improves care and outcomes, warranting future robust, quantitative studies of efficacy and effectiveness.”
Remote symptom monitoring integrated into electronic health records: A systematic review, Gandrup J Ali SM, McBeth J et al. JAMIA 2020.9.23
[Epidemiology] “Described as the “greatest global challenge for health and social care in the 21st century,” dementia is a debilitating disease that affects about 50 million individuals worldwide, a number projected to triple by 2050. Given the limited efficacy of current dementia treatments, society stands to benefit tremendously from public health prevention strategies. Hearing loss (HL) has been recently shown to be a treatable risk factor for dementia.
[..] Clinicians may be tempted to use the known independent association between HL and cognition to justify HL treatment (eg, hearing aids) to prevent age-related cognitive deficits. While appropriate management of HL is certainly recommended, a clear causal linkage between HL and cognition has yet to be found. In the meantime, the low risk and growing theoretical benefit of HL treatment warrant improved efforts to broadly test and treat. This article [a manuscript identifying an association between poorer hearing with longitudinal change in white matter microstructure] supports ongoing public health and legislative efforts to improve hearing health care.
Randomized clinical trials are the criterion standard for studying causal relationships; however, they may be impractical or even unethical to perform. For example, ensuring continuous wear of hearing aids throughout a clinical trial may be difficult because adherence is low, and prolonged withholding of hearing aids from an individual with HL may be unethical. Nonetheless, future prospective studies should be performed to further elucidate longitudinal relationships between HL and WM [brain white matter] microstructure. In particular, replication of these findings by other investigators using more diverse populations and various DTI [diffusion tensor imaging] approaches over a longer follow-up will be necessary to substantiate these findings.”
Mapping the Brain Effects of Hearing Loss: The Matter of White Matter, Chern A, Irace AL, and Golub JS. JAMA Otolaryngology – Head & Neck Surgery 2020.9.3
[Care Delivery Innovation] “Franklin Pharmacy is part of a UnitedHealthcare experiment in Ohio to put community pharmacists on the team of clinicians who care for a patient in hope of controlling chronic conditions and reducing hospital readmissions. The insurer is paying pharmacists to have these conversations, uncover any health and medication issues, and then do something about them.
“We tend to have better results in getting people care when we’re working with them within their communities,” said Michael Roaldi, who leads UnitedHealthcare’s Medicaid business in the state. “It occurred to us that pharmacies—community pharmacies and chain pharmacies—are literally thousands of examples of medical professionals in people’s communities that they regularly interact with that can be a conduit for receiving care.”
A number of other insurers in the state, including Centene-owned Buckeye Health Plan, CareSource, and Molina Healthcare, are rolling out similar pilots focused on Medicaid members in anticipation of new rules from the Ohio Department of Medicaid that would formally recognize pharmacists as healthcare providers and reimburse them for services that go beyond counting pills.
[..] “We’re at the beginning of a care revolution here,” said Antonio Ciaccia, former director of government and public affairs at the Ohio Pharmacists Association who was recently named a senior adviser to the American Pharmacists Association. “Once the diagnosis is made and the patient is on established therapy, having the pharmacist act as a touchpoint to make sure the patient is adequately calibrated on the therapy plan and on progress to meet their goal—that is right in their wheelhouse.”
[..] While there are a few mechanisms through which pharmacists can be paid for services beyond dispensing drugs and administering vaccinations, payment opportunities are limited, and that’s especially true for community pharmacists, said Anne Burns, vice president of professional affairs at the American Pharmacists Association.
A major reason is that Medicare Part B does not recognize pharmacists as healthcare providers, so pharmacists can’t bill the program for their services. Because other payers look to Medicare for guidance, CMS’ refusal to recognize pharmacists has dampened uptake of their services elsewhere, Burns said.
[..] Pharmacists have long argued their extensive training, medication expertise and accessibility could be tapped to manage patients with chronic diseases, who drive the bulk of healthcare spending. Their inclusion on the care team could alleviate the effects of the physician shortage on patients, they say. According to the National Association of Chain Drug Stores, 9 in 10 Americans live within 5 miles of a pharmacy.
[..] A wealth of evidence shows pharmacists have helped improve clinical outcomes for people with diabetes, hypertension, cardiovascular and respiratory diseases and other chronic illnesses. Some studies have also found that pharmacist interventions save healthcare costs. One review estimated that every $1 invested in clinical pharmacy services produced savings and other economic benefits of nearly $5.
Meanwhile, payment for dispensing has become tighter and tighter. Pharmacists are forced to fill prescriptions faster to stay afloat, leaving little time or incentive to counsel patients.
[..] pharmacy transformation is underway in Ohio. A law that took effect in April 2019 not only recognized pharmacists as healthcare providers but gave insurers the option to pay for higher-level pharmacist-provided services under the medical benefit. Pharmacists are usually reimbursed not by the insurer, but by the pharmacy benefit manager through the separate drug benefit, where incentives and goals differ.
Several other states, including Tennessee and Washington, have passed stricter laws that fostered payment for pharmacist services. [The other four states identified by the National Alliance of State Pharmacy Associations were New Mexico, Texas, West Virginia and Virginia.]
Many pharmacists, particularly those working in clinics, are now billing insurers as healthcare providers in Washington. Getting community pharmacists set up to bill health plans has been a heavier lift, said Jeff Rochon, CEO of the Washington State Pharmacy Association. Tennessee has also made strides, but both states have been more successful at getting local commercial plans on board. National insurers like UnitedHealthcare have been slower to adjust, Rochon said.
[..] “Don’t you want to incentivize the pharmacist to actually get them on the right medicine, make sure the dosing is correct and monitor those medications to see if the patient’s getting better? That’s the incentive I’m going for, and those are the same incentives and the same metrics these payers and primary-care offices are currently being held to, and they’re not meeting them,” said Stuart Beatty, associate professor of clinical pharmacy at Ohio State University who directs strategy and practice transformation at the pharmacists association.
[..] One by one, Ohio health insurers began to bite. Most of the five Medicaid managed-care companies in the state have rolled out their own programs to experiment with how they can best use pharmacists’ expertise to care for Medicaid patients, each taking a different approach to ensure care doesn’t become duplicative or fragmented.
[..] UnitedHealthcare’s program gave pharmacists flexibility in who they see and what they can do within their scope of practice. It encourages pharmacists to keep the primary-care physician in the loop by paying them for time spent coordinating care with the doctor.
A six-month pilot launched in August by CareSource, the largest Medicaid managed-care insurer in the state, is more prescriptive and requires pharmacists to enter upfront agreements with primary-care doctors who will sign off on which basic services they are comfortable delegating to pharmacists. A physician may allow the pharmacist to adjust or prescribe new medications, for instance.
[..] For now, insurers are paying pharmacists for extra services out of their own pockets. CareSource said it’s paying pharmacists $25 for 15 minutes spent with the patient, and will move to medical code billing as soon it can. UnitedHealth said it is paying pharmacists based off the physician fee schedule but at a reduced rate.
Under draft rules, the Ohio Department of Medicaid would foot the bill for high-level services provided to the state’s 3 million Medicaid enrollees. Most members receive benefits through private insurers that contract with the state to manage their care.
[..] [Ohio Medicaid director Maureen] Corcoran said pharmacists would be able to bill evaluation and management codes for clinical consultations on asthma, diabetes, cancer or any condition that involves medication. The draft rules, which could change during the rulemaking process, specify payment for managing medication therapy and administering immunizations and certain medications.
Like in CareSource’s program, the department would require a pharmacist to have an agreement with a patient’s primary-care doctor, rather than acting independently. Some groups, including the National Community Pharmacists Association, have said the draft rules are too narrow and would unnecessarily limit what a pharmacist can do.
Insurers will adapt their programs to meet the Medicaid department’s rules when finalized early next year. They could still choose to pay for pharmacist services beyond what the state pays for, but the companies would be footing the bill. Each pharmacist who wants to bill Medicaid for these higher-level services would have to enroll in the safety net program.
[..] The billing process has been especially difficult to nail down because it hasn’t been defined, she [Meera Patel-Zook, vice president of pharmacy operations at Buckeye Health Plan] said. Buckeye’s pilot that launched in June started with two federally qualified health centers and a hospital system because they already had pharmacists embedded in their facilities and were used to collaborating. The pilot will soon include two independent community pharmacies, and the variety of settings helps the insurer test how processes will differ between them.
[..] Other challenges include getting patients and physicians to embrace the changes. Todd Baker, CEO of the Ohio State Medical Association, said the group opposes giving pharmacists independent authority to prescribe medications and order or interpret tests.”
I work for UnitedHealthcare.
Pharmacists in Ohio managing care as providers—and getting paid for it too, Livingston S. Modern Healthcare, 2020.9.26
[..] The new data show that outbreaks linked to parties, bars, dormitories and other crowded venues are hazardous not just to the 20-somethings who are present, but to more vulnerable Americans with whom they are likely to come into contact.
[..] “This is what we worried would happen if young adults started regathering in higher numbers,” said Dr. Tom Inglesby, director of the Center for Health Security at Johns Hopkins Bloomberg School of Public Health.
[..] He said the patterns are “yet more evidence that the concept proposed by some — cocoon the elderly, and let young people get sick because they will not have bad outcomes — will not work.”
Virus Cases Surged in Young Adults. The Elderly Were Hit Next. Rabin RC. New York Times, 2020.9.24
2020.9.25
“There are multiple examples of existing independent federal agencies, including the Federal Reserve System and the Federal Trade Commission, that can make decisions swiftly during national crises without Presidential or Congressional approval. A framework of essential attributes shared across these agencies has previously been described in a proposal to make the US Food and Drug Administration (FDA) independent, including the following key attributes:
- a single director appointed by the President and confirmed by the Senate (akin to that of the Federal Reserve),
- rule-making authority in accordance with Congressional enabling legislation and intent,
- oversight by the Office of Management and Budget limited to significant regulations and policy development, and
- independent litigation authority through the Department of Justice.
As an independent federal agency, the CDC could be governed by a single director and include a governing board with diverse lifetime experiences in public health. Additionally, to prevent politicization of the board, each member could require Senate confirmation to be appointed, serve staggered terms that span multiple presidential and congressional terms, and receive protections from budgetary cuts. Many independent agencies are not subject to regular congressional appropriation and authorization processes for funding. Some agencies, including the Consumer Financial Protection Bureau, determine their own budgets, with some limitations enforced by Congress, and are not required to submit their request for review by the Office of Management and Budget. A similar degree of autonomy for the CDC could help ensure it maintains funding required to protect public health regardless of the political climate.
To ensure accountability, CDC board members could be removed for cause and reappointed via congressional approval. The CDC could also have some rule-making (eg, nationwide mandates, emergency declarations) supervised by the Office of Management and Budget. Importantly, to counterbalance federal oversight, the CDC could have independent litigation authority through the Department of Justice to challenge excessive oversight. This balancing of authority would safeguard against politicization from those acting in bad faith who belong to either entity.
[..] Given the saga of the nation’s response to COVID-19, the CDC needs to be freed from its politicized governance. Without the capacity to act autonomously, the CDC will continue to be constrained by politics—undermining the public’s trust in the agency and risking the nation’s health.”
The Case for Independent Centers for Disease Control and Prevention—Protecting Public Health from Politics Shah S and Forman H. JAMA Health Forum 2020.9.25
The Agency for Healthcare Research and Quality plans to release a survey next month that providers can use to assess patient experience with telehealth visits. [..] AHRQ, which oversees and funds a suite of widely used patient experience surveys called Consumer Assessment of Healthcare Providers and Systems (CAHPS), will release the survey sometime in October as a beta version to any providers who want to use it, according to Caren Ginsberg, director of the CAHPS program at AHRQ [..].
The survey won’t have the CAHPS logo because it hasn’t gone through the long approval process including field testing, but Ginsberg said AHRQ leaders thought it was important providers had access to the survey soon given the expanded use of telehealth.
[..] Most reports show patients are satisfied with telehealth although there are concerns the platform isn’t improving access for everyone, particularly those who don’t have reliable access to broadband or devices.
[..] Right now, Medicare requires hospitals to participate in the Hospital CAHPS survey, known as HCAHPS, but it must be administered through mail or phone, which hospital leaders say is outdated and unhelpful to them. Responding to those complaints, CMS plans to test in the spring a “web mode” version of multiple patient experience surveys and for HCAHPS, it will ask a nationally representative group of hospitals to participate, according to an agency spokeswoman. The testing is scheduled to begin in April 2021, but the spokeswoman said COVID-19 may cause delays.”
AHRQ plans to release a telehealth patient experience survey Castellucci M. Modern Healthcare 2020.9.24
2020.9.24
The Trump administration and House Democrats share one idea regarding pharmaceutical price controls: They agree that the US should use an international price index that averages prices paid by other countries (mostly European) to cap the US prices. PhRMA has long opposed such policies, recently renewing its opposition. Unacknowledged and perhaps unknown to those proposing this reform is that at least 25 EU nations employ a pharmaceutical price index to cap their own drug prices.
In July 2020, President Donald Trump signed an executive order indicating he would soon implement an earlier international price index (IPI) proposal that would cap drug prices in Medicare Part B (for drugs used in hospitals). [..] In contrast, the House Democrats bill would cap drug prices for all of Medicare and private insurers based on an Average International Market (AIM) Index, which is the volume-weighted average of each drug price in Australia, Canada, France, Germany, Japan, and the United Kingdom.
[Key Lessons from European Nations]
- The IPI should be based on maximum reimbursement after discounts or on net prices—not on official prices.
- Employ health technology assessment (HTA) to determine the therapeutic value of new drugs to cap reimbursement, in addition to employing a cap based on an IPI.
- Employ index prices to cap prices for drugs that are superior to existing products, but cap prices of other drugs based on the price of comparable products.
- Use competitive bidding to obtain drugs at lower prices than maximum reimbursement allowed.
The official maximum reimbursement prices are significantly more—by some estimates between 10 percent and 30 percent more—than that maximum amount allowed after confidential discounts are subtracted. In addition, the procurement price is often subsequently reduced by clawback payments: For example, in France, Parliament sets an annual maximum spending growth rate. If the spending exceeds the budget, firms pay 50 percent to 70 percent of their sales revenue after the budget cap is surpassed, depending on the amount of overspending.
[..] A US international drug price index used to cap prices should estimate actual amounts reimbursed, or net prices, not official prices prior to discounts. Nor need the US pay 120 percent of what comparably wealthy countries are paying. With a larger market, the US has greater bargaining power than individual European nations and can use this to negotiate price discounts. Nor need the US allow pharmaceutical firms to raise prices subsequently to account for inflation, since European nations that employ an IPI do not allow price increases for inflation.
Although the US has used competitive bidding to procure certain federal supplies, it has not generally employed this strategy to procure drugs for Medicare and Medicaid.”
Average International Market Pricing For US Pharmaceuticals—Lessons From Europe Rodwin MA. Health Affairs Blog 2020.9.24
“One decade after passage of the Patient Protection and Affordable Care Act (ACA), despite substantial gains in insurance coverage, health care affordability remains a major concern among US residents. Premiums are increasingly unaffordable, and underinsurance—incomplete financial protection despite coverage—is increasingly common. Although previous research has shown that the ACA’s Medicaid expansions decreased out-of-pocket spending among low-income adults, broader trends in out-of-pocket spending have not been well characterized.
[..] We obtained income, insurance coverage, and spending data from a nationally representative sample of adults aged 20 to 64 years in the Medical Expenditure Panel Survey, collected from 2010 to 2017. Our primary outcome was catastrophic health expenditures, defined with the World Health Organization threshold of calendar-year out-of-pocket plus premium spending exceeding 40% of postsubsistence income (calendar-year income minus typical food and housing expenditures from the Bureau of Labor Statistics).
We identified 159 941 survey respondents (49.1% men; mean age, 41.8 years [SD, 12.6 years]), representing 186 million individuals annually after survey weighting. The number of uninsured nonelderly adults declined from 42.9 million (23.5%) in 2010 to 27.9 million (14.8%) in 2017, whereas those with Medicaid coverage increased from 11.0 million (6.0%) to 18.3 million (9.7%) (P < .001). Coverage gains were concentrated in the 2 lower income quartiles, in which the uninsured rate decreased from 44.1% to 28.6% (lowest quartile) and 27.0% to 18.7% (P < .001).
The number of adults experiencing catastrophic expenditures yearly declined from 13.6 million (7.4%) in 2010 to 11.2 million (5.9%) in 2017 (P < .001). Privately insured adults composed 46.4% of catastrophic expenditure cases in 2010 and 53.6% in 2017 (P < .001).
In our interrupted time series analysis, individuals in the lowest income quartile experienced a 2.3 percentage point decrease in likelihood of catastrophic expenditures (95% CI, −4.6 to −0.1), whereas no change was observed in other income quartiles. Stratified by insurance type, privately insured individuals experienced no change in catastrophic expenditures (adjusted change, −0.2 percentage point; 95% CI, −1.4 to 1.0). Finally, in our subanalysis of the lowest income quartile, privately insured individuals again experienced no change (adjusted change, −2.8 percentage points; 95% CI, −9.5 to 3.8), and in fact had the highest rate of catastrophic spending in 2017 (34.6% vs 8.3% among Medicaid enrollees and 13.9% among the uninsured).
ACA implementation was associated with 2 million fewer US adults with catastrophic expenditures each year. Financial protection improved for the lowest income quartile, which was one of the ACA’s principal aims. However, improvements were not observed in higher income quartiles or among the privately insured, who represent an increasing share of those experiencing catastrophic expenditures. Among individuals in the poorest quartile, the privately insured are the most vulnerable, with one-third experiencing catastrophic spending annually.
Despite large coverage gains, 11 million US adults, including 6 million with private insurance, continue to experience catastrophic health expenditures annually. [..] Health reform should move beyond expanding insurance coverage alone to address persistently high out-of-pocket spending among the insured.”
Catastrophic Health Expenditures Across Insurance Types and Incomes Before and After the Patient Protection and Affordable Care Act Liu C, Chhabra KR and Scott JW. NAMA Network Open 2020.9.24
“Whereas brachytherapy (BT) and dose-escalated external beam radiotherapy (DE-EBRT) have longstanding use in the treatment of patients with localized prostate cancer (CaP), stereotactic body radiation therapy (SBRT) is an emerging option owing to cost effectiveness, patient convenience, and noninferior tumor control and acute toxic effects. The increase in radiation options and paucity of comparative evidence present challenges in guiding patient-centered care. Using the National Cancer Database, we compared use and outcomes between SBRT, BT, and EBRT for the treatment of patients with intermediate risk CaP.
[..] patients were identified in the National Cancer Database who had National Comprehensive Cancer Network intermediate risk CaP (Gleason score of 6-7, clinical stage T1-T2, and prostate-specific antigen <20 ng/mL [to convert to micrograms per liter, multiply by 1.0]) diagnosed between January 1, 2004, and December 31, 2014. For EBRT, only ≥75 Gy or ≥42 fractions of treatment were included. Stereotactic body radiation therapy was defined as 5 fractions of ≥7 Gy per fraction.
[..] A total of 12 864 patients (41.8%) received BT, 17 247 (56.1%) received DE-EBRT, and 655 (2.1%) received SBRT. From 2004 to 2014, SBRT use (0.03% to 10.6%) and DE-EBRT use (48.3% to 62.0%) steadily increased, with a corresponding decline in BT use (48.3% to 27.4%).
[..] The median follow-up was 6.7 years (range, 0-11.9 years). In the favorable intermediate risk cohort, there was no significant OS difference in pairwise comparisons of BT vs SBRT (HR, 0.804; 95% CI, 0.593-1.09; 10-year OS, 67.02% vs 64.2%) or SBRT vs DE-EBRT (HR, 1.096; 95% CI, 0.810-1.48; 10-year OS, 64.2% vs 70.9%). Men receiving BT had a small but statistically significant improvement in OS compared with those receiving DE-EBRT (HR, 0.881; 95% CI, 0.829-0.938; 10-year OS, 69.8% vs 66.1%).
In the unfavorable intermediate risk cohort, there were no OS differences in pairwise comparisons between BT and SBRT (HR, 0.749; 95% CI, 0.419-1.34; 10-year OS, 64.9% vs 63.2%) and between SBRT and DE-EBRT (HR, 1.36; 95% CI, 0.746-2.69; 10-year OS, 63.2% vs 66.6%). Men receiving BT demonstrated a small but statistically significant improvement in OS compared with those receiving DE-EBRT (HR, 0.818; 95% CI, 0.716-0.936; 10-year OS, 61.2% vs 58.7%).
[..] This cohort study is a preliminary evaluation comparing outcomes of patients with intermediate-risk CaP, with results suggesting no difference in long-term survival between patients treated with SBRT, EBRT, or BT. These findings corroborate the results of the Hypofractionated Radiotherapy of Intermediate Risk Localised Prostate Cancer (HYPO-RT-PC) study demonstrating noninferior 5-year failure-free survival between ultrahypofractionated and conventionally fractionated therapy. Although BT has long been shown to be both clinically effective and cost-effective in the management of localized CaP, many studies, including the present study, show a decline in use over the last decade. As radiation modalities trend toward hypofractionation with major considerations toward cost-effective treatment, our preliminary evaluation suggests that SBRT and BT remain appropriate management strategies in delivering value-based care.”
Trends in Use and Comparison of Stereotactic Body Radiation Therapy, Brachytherapy, and Dose-Escalated External Beam Radiation Therapy for the Management of Localized, Intermediate-Risk Prostate Cancer Nguyen KA, Lee A, Patel SA et al. JAMA Network Open 2020.9.24
2020.9.23
“As the largest integrated and federally operated health care system in the US, the practice environment at the VHA differs considerably from other systems, potentially impacting the provision of low-value care. For example, VHA clinicians do not operate within a fee-for-service system and are insulated from malpractice litigation. Moreover, the VHA electronic medical record contains information on veterans’ care across all Veterans Affairs Medical Centers (VAMCs) and decision support tools for ordering appropriate health services, which may be associated with a decreased likelihood of VA clinicians delivering low-value care.”
Low value diagnostic tests:
- Back imaging for patients with non-specific low back pain
- Head imaging for uncomplicated headache
- Electroencephalogram (EEG) for headaches
- Head imaging in patients with syncope
- Assessing for carotid artery disease in patients with syncope
- CT scan of the sinuses for uncomplicated acute rhinosinusitis
The researchers included reasonable filters to exclude clinically appropriate patients.
[end of appendix review.]
“When applying the sensitive criteria, overall and VAMC-level low-value testing frequency varied substantially across conditions: 18.2% (adjusted VAMC range, 10.9%-24.6%) for low back pain, 12.8% (range, 8.6%-22.6%) for headache, 20.1% (range, 16.3%-27.7%) for syncope, and 4.6% (range, 2.7%-10.1%) for sinusitis. With the specific criteria, the overall frequency of low-value testing across VAMCs was lower: 5.6% (range, 3.6%-7.7%) for low back pain, 8.6% (range, 6.2%-14.6%) for headache, 13.3% (range, 11.3%-16.8%) for syncope, and 2.4% (range, 1.3%-5.1%) for sinusitis. In veterans with a Gagne Comorbidity Score in the top decile and thus at greatest risk of mortality at 1-year, overall rates and ranges across VAMCs were similar to those demonstrated in the overall cohort when applying both the sensitive and specific criteria.
[..] Low-value testing for different conditions was significantly correlated at the VAMC level, with ρ values ranging from 0.18 (P = .04) for the correlation between syncope and sinusitis to 0.56 (P < .001) for the correlation between syncope and headache. When evaluating the correlation between the use of separate low-value tests for syncope, head imaging and carotid ultrasonography were significantly correlated when applying both the sensitive (ρ = 0.40; P < .001) and specific (ρ = 0.21; P = .02) criteria. For headache, use of head imaging and electroencephalography were significantly correlated when applying the sensitive criteria (ρ = 0.26, P = .003) but not when applying the specific criteria (ρ = 0.13, P = .16).
[..] In a national cohort of veterans, low-value diagnostic testing was common, affecting from 5% to 21% of veterans based on their underlying condition and similarly affecting those at greatest risk of 1-year mortality. We also identified 2- to 5-fold variation in low-value testing across VAMCs and significant correlation at the VAMC level in veterans’ receipt of such testing.
[..] Our findings are notable in that VA clinicians are not subject to the same incentives and circumstances commonly associated with low-value testing in non-VA settings in the US. [..] the variation that we observed in low-value testing across VAMCs could not be easily explained by the traditional veteran- and VAMC-level covariates that we incorporated in our analyses. This suggests that unique local factors, such as those related to provider culture and variations in the robustness of decision support for ordering tests and procedures at each VAMC, are associated with low-value testing. Similar factors may also play a role in other non-US health systems, such as Canada’s, where low-value care is broadly present despite operating largely within a single payer system. Identifying these factors will be essential for the development of interventions to reduce the delivery of such care in the VHA and other integrated health care systems.
The correlations of the receipt of low-value testing among the health conditions in our study also suggest that the delivery of such care at VAMCs is associated with systemic factors that are not specific to the delivery of an individual test.”
Evaluation of Low-Value Diagnostic Testing for 4 Common Conditions in the Veterans Health Administration Radornski TR, Feldman R, Huang YH et al. JAMA Network Open 2020.9.22
“Many institutions have focused on the proliferation of solutions and technologies supporting ambulatory care, along with health systems’ increasing focus on extending care along the continuum. Importantly, these trends will not dissipate soon, as they are driven by more fundamental, interrelated market changes:
1. Innovation and technology: Advances in clinical approaches and technology, including new developments in anesthesia and pain control, as well as minimally invasive surgical procedures, have enabled numerous procedures (for example, knee replacements, tonsillectomies) to migrate into the ambulatory setting.
3. Payer pressure: The growth of at-risk contracts and value-based care
4. Provider opportunity: Shared ownership models financially align physicians to accelerate this shift to outpatient care.
[..] We created a tool that analyzed a database of Commercial claims from across the United States in 2016. This database represented 1.4 billion national medical claims and more than $620 billion in cost. After excluding post-acute and other care, the claims were grouped together into 615 million encounters for ambulatory and inpatient care that represented $490 billion in cost. Each encounter was then given a priority procedure to enable comparisons to be made. Of the 615 million encounters, roughly 10 percent were coded as primarily surgical, 13 percent as primarily medical, and the remaining roughly 77 percent spanned office appointments, preventative care, and emergency department visits.
[..] By our estimates, $60 billion of encounters take place almost exclusively in an inpatient setting, while $300 billion of encounters take place almost exclusively in an ambulatory care setting, where “exclusively” is defined as encounter codes where more than 95 percent of care takes place in one setting. This means 27 percent of spend [2483 primary encounter codes accounting for $132 billion in value] represents encounters that have meaningful variations in site of care choices. These “mixed” encounter codes represent bundles where a notable volume of activity takes place in an ambulatory setting and suggests that the approach, technology, and clinical protocols exist to support care in these settings. Across the analysis, an average cost saving of $21,000 for the same encounter code bundle took place in an ambulatory setting instead of an inpatient setting. Given this variation, disseminating practices that support more patients in ambulatory care could be of value to cost-conscious patients, providers, and payers.
[..] providers should look to focus on (1) “low-hanging fruit,” where 65 to 95 percent of encounters are already in outpatient settings, and (2) “leading procedures,” where 5 to 35 percent of encounters are already in outpatient settings, suggesting a slow, sub-scale migration out of acute sites.

[..] Prior to the onset of COVID-19, we surveyed 150 cardiology and 150 orthopedic physicians on their expectations of where they think opportunities exist to make targeted moves over the next decade.
[..] The CPT codes surveyed represented 15 million encounters across inpatient and ambulatory settings. Today, 10 percent of this activity takes place in an ambulatory setting [..]. Within ten years, care delivered in an ambulatory setting is expected to grow to 32 percent of the total activity. This increase represents an average growth of 12 percent per annum, with meaningful differences across specialties. More specifically, orthopedics is expected to see higher growth from a lower base, from 5 percent ambulatory activity today to 26 percent in a decade, while cardiology is expected to grow from 16 percent today to 40 percent in a decade.
[..] there are likely to be other procedures beyond cardiology and orthopedics where significant innovation and changes in the site of care could be captured, as well as greater interest from physicians in the wake of COVID-19 to shift procedure volume away from the hospital setting.”
Walking out of the hospital: The continued rise of ambulatory care and how to take advantage of it Kumar P and Parthasarathy R. McKinsey & Company 2020.9.18
2020.9.22
“The aim of this study was to develop equations to convert urine PCR [protein-creatinine ratio] and dipstick protein to ACR [albumin-creatinine ratio] and to evaluate their performance for use in efforts to screen for, categorize, and risk-stratify patients with CKD [chronic kidney disease].
[..] For PCR values above 50 mg/g, the relationship between PCR and ACR was nearly linear on the log scale, with a shallower slope for values greater than 500 mg/g than for those from 50 to 500 mg/g and relative consistency across cohorts. Below a PCR of 50 mg/g, little consistency in association was seen across cohorts. The crude model showed a 2.99-fold increase in predicted ACR for each doubling of PCR in the range of 50 to 500 mg/g, and a 2.18-fold increase in predicted ACR for each doubling of PCR over 500 mg/g. In the adjusted model, the respective increase in predicted ACR for changes in PCR was similar (2.96-fold and 2.16-fold) and the effects of sex, diabetes, and hypertension on the relationship were relatively small.
[..] Scatter plots of observed versus predicted ACR showed closer approximation in the higher than lower levels in most cohorts. [..] The predicted values of ACR for trace, +, ++, and greater than ++ dipstick protein categories were 25 mg/g (prediction interval, 8 to 80 mg/g), 67 mg/g (prediction interval, 21 to 207 mg/g), 337 mg/g (prediction interval, 132 to 860 mg/g), and 1229 mg/g (prediction interval, 734 to 2057 mg/g), respectively. A tool for converting PCR or dipstick values to ACR is available at ckdpcrisk.org/pcr2acr.
[..] The meta-analyzed sensitivity and specificity of the urine dipstick categories of trace and greater for detecting ACRs of 30 mg/g and above were 62.0% (CI, 50.9% to 72.0%) and 87.8% (CI, 83.3% to 91.2%), respectively, and pooled median positive and negative predictive values were 70.8% (25th to 75th percentile of cohorts, 65.8% to 73.6%) and 81.7% (25th to 75th percentile of cohorts, 77.6% to 85.2%), respectively.
[..] The sensitivity and specificity of the crude PCR conversion equation for identifying CKD stage A2 (ACR of 30 to 299 mg/g) were 74.9% (CI, 70.8% to 78.7%) and 88.7% (CI, 86.3% to 90.7%), respectively, and the positive and negative predictive values were 72.5% (25th to 75th percentile of cohorts, 69.2% to 75.6%) and 88.7% (25th to 75th percentile of cohorts, 86.0% to 91.1%), respectively. The equations had slightly higher sensitivity and higher specificity for detecting CKD stage A3 (ACR ≥300 mg/g), with meta-analyzed sensitivity and specificity of 86.6% (CI, 83.5% to 89.2%) and 97.5% (CI, 96.2% to 98.3%), respectively, and pooled median positive and negative predictive values of 90.4% (25th to 75th percentile of cohorts, 88.3% to 94.8%) and 95.1% (25th to 75th percentile of cohorts, 91.5% to 97.5%).
Dipstick values of trace to + had lower sensitivity and specificity for CKD stage A2. Dipstick values of ++ had meta-analyzed sensitivity and specificity of 77.6% (CI, 71.7% to 82.6%) and 97.5% (CI, 95.5% to 98.6%), respectively, for CKD stage A3. Diagnostic performance was highly similar among subgroups based on sex, diabetes, hypertension, and CKD G (glomerular filtration rate) stage.
[..] In the crude model, the sensitivity and specificity for the 2-year 40% kidney failure risk threshold were 80.5% and 99.6%, respectively, in cohorts that sent data to the Data Coordinating Center and 95.6% and 99.4%, respectively, in the OLDW cohorts.
[..] In this international collaborative meta-analysis of 919,383 participants from 33 cohorts, we found an overall consistent relationship between PCR and ACR for PCR values greater than 50 mg/g and between urine dipstick protein categories and ACR across a wide range of cohorts. We developed equations for converting PCR or urine dipstick protein categories to ACR and evaluated them for potential use in individual screening and classification efforts and risk prediction. For efforts to categorize patients into CKD stages A2 and A3, the PCR conversion equations demonstrated moderate sensitivity and specificity (>74%) for detecting ACRs of 30 to 299 mg/g and 300 mg/g and greater; the urine dipstick categories of trace to + and ++ had high specificity (>88%) but lower sensitivity (<78%) for identifying ACRs of 30 to 299 mg/g and 300 mg/g and greater, respectively. For individual risk prediction, the estimated 2-year 4-variable KFRE using predicted ACR was very similar to the one using observed ACR.
Our empirically developed equation for converting PCR to ACR corresponded well with threshold estimates in the current KDIGO guideline on CKD staging. The guideline recommends use of ACR for defining and staging CKD, with ACR values of 30 mg/g and 300 mg/g defining albuminuria categories A2 and A3, respectively. Our crude equation suggests that a “trace” value on urine dipstick corresponds to an ACR of 25 mg/g, “+” corresponds to an ACR of 67 mg/g, and “++” corresponds to an ACR of 337 mg/g. Likewise, we estimate in the crude PCR equation that a PCR value of 150 mg/g corresponds to an ACR of 33 mg/g, albeit with a prediction interval of 12 to 90 mg/g, and that a PCR value of 500 mg/g corresponds to an ACR of 220 mg/g (prediction interval, 113 to 427 mg/g). These conversions are quite similar to those suggested by KDIGO, in which dipstick protein values of “trace to +” and “+ or greater” and PCR values of 150 to 500 mg/g and greater than 500 mg/g are assigned to albuminuria categories 30 to 299 mg/g and 300 mg/g or greater, respectively. In contrast, our results were slightly different from the suggested value of nephrotic-range proteinuria, noted as a PCR value of 3000 mg/g or an ACR value of 2220 mg/g in the guideline. On the basis of our crude model, a 3000-mg/g PCR corresponded to a 1603-mg/g ACR (prediction interval, 1015 to 2532 mg/g).
[..] Although the adjusted equation incorporated sex, hypertension, and diabetes, the coefficient values were small. Given that the crude model is simpler and performs nearly the same as the adjusted model, the crude equation may be preferable for ease of implementation.
[..] Studies have consistently shown that urine dipstick testing has low sensitivity for CKD screening (ACR ≥30 mg/g) despite its high specificity. Indeed, in our study, the dipstick category of trace and greater had low sensitivity (62.0%) but high specificity (87.8%) for detecting ACRs of 30 mg/g or greater. However, if detecting CKD stage A3 (ACR ≥300 mg/g) were the goal, the sensitivity of the ++ category was 77.6%, with a specificity of 97.5%. In many settings, access to laboratory services is limited, and low-cost diagnostic tools, such as urine dipstick tests, are essential. The performance of these tools should be evaluated within the local context of test availability, cost, and objectives in considering strategies for CKD screening and staging.
[..] Although further testing is required to establish the robustness and utility of these equations, our results suggest that if ACR is not available, predicted ACR may be useful and informative for harmonization across research studies, CKD screening and classification efforts, and use in risk prediction equations.”
Conversion of Urine Protein–Creatinine Ratio or Urine Dipstick Protein to Urine Albumin–Creatinine Ratio for Use in Chronic Kidney Disease Screening and Prognosis: An Individual Participant–Based Meta-analysis Sumida K, Nadkarni GN, Grams ME et al. Annals of Internal Medicine 2020.7.14
2020.9.21
“In June 2020, the VA/DoD [US Department of Veterans Affairs/Department of Defense] released an evidence-based update to their 2014 clinical practice guideline for managing dyslipidemia to reduce CVD risk.
- We recommend moderate-dose statin therapy for patients with a 10-y CVD risk ≥12%, an LDL-C level ≥4.9 mmol/L (≥190 mg/dL), or diabetes. (primary prevention)
- We recommend against offering PCSK9 inhibitors because their long-term safety is unknown, evidence for their benefit is inconclusive, and they are expensive. (primary prevention)
- For primary or secondary prevention, we recommend against using niacin (either supplements or prescription formulas).
- We recommend a structured, exercise-based cardiac rehabilitation program for patients with recent coronary heart disease (i.e., MI, diagnosis of coronary artery disease, CABG surgery, or PCI) to reduce cardiovascular morbidity and mortality. (lifestyle intervention)
[The authors own highlights based on relevance to practice]
- Continue to treat to target dose, not LDL-C level
- Use of additional tests to refine risk prediction: Evidence is still insufficient
- Primary prevention: Moderate-dose statin therapy is still emphasized; No to proprotein convertase subtilisin/kexin type 9 inhibitors
- Secondary prevention: Moderate statin doses initially, then stepped intensification in higher-risk patients
- Laboratory testing: No routine fasting or monitoring is needed
- Physical activity: Increased aerobic exercise for all and cardiac rehabilitation after a recent CVD event
- Nutrition supplements, niacin and fibrates: Suggest a Mediterranean diet for high-risk patients, Limit icosapent ethyl to secondary prevention, Avoid supplements and niacin, and avoid adding fibrates to statin therapy
“the evidence relating patient-oriented outcomes to LDL-C levels consisted of trial comparisons between therapy intensities, not LDL-C target levels. Because no study prospectively evaluated LDL-C goals, the EBPWG decided to focus on treatment intensity to match the evidence and simplify point-of-care decision making.
Because of the lack of direct evidence of benefit from using target LDL-C goals, we recommend the use of target medication doses consistent with the clinical trials, most of which used moderate statin doses. We believe the use of LDL-C targets is more likely to lead to harm associated with higher statin doses or combination medical therapy, for which there is little evidence.”
“Much effort has been made to improve these tools with additional testing, such as coronary artery calcium (CAC), high-sensitivity C-reactive protein, ankle–brachial index, and apolipoprotein evaluations. However, our updated review of the literature on the added prognostic value of these tests indicates that they are limited in further refining risk. Only CAC scoring provided a statistically significant net reclassification of risk of at least modest magnitude, although its impact on clinical outcomes is uncertain, even when it is applied to intermediate-risk populations, who would benefit most. Without prospective RCT evidence demonstrating improvement in critical outcomes, we do not believe the added cost and radiation risk of CAC scoring can be justified in refining risk assessment for primary prevention subpopulations.”
“For patients with a 10-year risk greater than 12%, clinical trials indicate that CVD risk may be decreased by 20% to 30% with moderate-dose statin therapy for 5 years. The rationale for using a threshold of 12% is that it most closely resembles that of the clinical trial populations in which the benefits clearly outweighed the risks. [..] No RCT directly compared high-dose with moderate-dose statin therapy in primary prevention. Given the higher risk for adverse effects with high-dose statin treatment and the absence of evidence for added benefit compared with moderate doses, we believe the appropriate goal dose for primary prevention should be moderate (same as moderate intensity). We therefore recommended against the use of high-dose (or high-intensity) statin therapy in primary prevention.
No clinical trial of nonstatin therapies has directly proved a reduction in cardiovascular mortality in primary prevention populations. Nonstatin treatments include ezetimibe and proprotein convertase subtilisin/kexin type 9 (PCSK9) inhibitors. One systematic review of PCSK9 inhibitor trials showed that of the primary prevention patients included in the studies (n > 10,000), none obtained a benefit in any cardiovascular outcome. Given the uncertain safety of long-term use, lack of evidence of benefit, and high cost of PCSK9 inhibitors, we strongly recommend against their use for primary prevention.”
“A large body of clinical trial evidence supports moderate-dose statin therapy in secondary prevention populations, with demonstrated reductions in cardiovascular and all-cause mortality over approximately 5 years. The preponderance of evidence is derived from trials of moderate statin doses, with very few trials directly comparing the effectiveness of high- versus moderate-dose statin treatment.
[..] Substantial evidence exists that high- versus low- or moderate-dose statin therapy reduces cardiovascular morbidity but not mortality. This evidence is derived mostly from higher-risk secondary prevention populations, such as those with recent MI or acute coronary syndrome (in the past 12 months); recurrent acute coronary syndrome, MI, or stroke; or established CVD with additional major risk factors (such as current tobacco use, diabetes, peripheral artery disease, or previous coronary artery bypass graft surgery or percutaneous coronary intervention). Evidence also exists that high-dose statin therapy is associated with higher rates of adverse outcomes (such as treatment discontinuation, myopathy, and incident diabetes). [..] high-dose statin therapy should be offered through shared decision making with patients, and preferentially to higherrisk populations (such as those with recurrent events or those with known multivessel obstructive coronary or peripheral artery disease and active tobacco use or diabetes), from which the evidence was derived.”
“we continue to recommend the evaluation of nonfasting lipid levels for risk assessment and monitoring, on the basis of further evidence that fasting lipid levels add no clinical value to risk prediction compared with nonfasting levels and are considerably more burdensome in terms of patient inconvenience and cost.
[..] In our systematic review, we found that lipid levels vary little in a patient over time and that true variation
exceeds random variation only if testing is spaced by 9 to 10 years. Thus, given the small contribution of lipid values to calculating a cardiovascular risk score, the focus on targeted dosing (as opposed to target cholesterol levels), and the minimal within-patient variation over time, we recommend measuring lipid levels no more than every 10 years. One can reliably use the previously measured lipid value in assessing CVD risk. We do not recommend rechecking lipid levels each time CVD risk is assessed, because lipid levels remain stable within persons over time and contribute only a small amount to predicted risk relative to other factors. Once moderate-dose statin therapy is prescribed (the therapeutic goal for managing lipid levels in primary CVD prevention), we see no rationale for monitoring lipid levels thereafter.”
“On the basis of mostly observational evidence for primary and secondary CVD prevention, we recommend regular aerobic physical activity of any intensity and duration. This is a weak recommendation based on the observational nature of the data. Although the widely propagated recommendations from the Physical Activity Guidelines for Americans specify 150 minutes of moderate-intensity or 75 minutes of vigorous physical activity per week, our systematic review discovered only observational data supporting a graded association between physical activity and reduction in cardiovascular and all-cause mortality. The largest difference in risk was observed between persons who exhibited sedentary behavior compared with those at the lowest levels of regular physical activity. The lack of RCT data limited our grading of this evidence to make any further specific recommendation. Thus, we believe that recommending regular physical activity of any duration and at any intensity is most consistent with the available evidence. This broader recommendation has implications for generalizability and feasibility, specifically in patients who are elderly or have poor physical
function.
For secondary prevention in patients with recent CVD events, we strongly recommend a structured, exercise-based rehabilitation program, on the basis of robust evidence of improvement in nonfatal MI and both cardiovascular and all-cause mortality. A systematic review and meta-analysis of 69 mostly moderatequality clinical trials of cardiac rehabilitation reported a 26% relative risk reduction in cardiovascular mortality over a median of 10 years. Although the characteristics of these programs were somewhat heterogeneous, common elements included early initiation relative to the event (within 2 to 8 weeks) and the structured nature of the exercise programs.”
“A systematic review of 30 RCTs found only low-quality evidence but did show that a Mediterranean diet reduced composite events, stroke, MI, and both cardiovascular and all-cause mortality. The benefit was limited to high-risk primary prevention and secondary prevention populations. The Mediterranean diet includes a high unsaturated–saturated fat ratio, high proportion of caloric intake from plant-based foods (fruits, vegetables, nuts, legumes, and grains), moderate consumption of fish and low-fat dairy products, and low intake of lean meat and red wine. Although it is reasonable to consider other diets that comprise the same elements, the only specific diet studied in an RCT and powered for CVD outcomes is the Mediterranean diet.
[..] for secondary prevention, we suggest offering icosapent ethyl to patients receiving statins who have fasting triglyceride levels persistently greater than 1.7 mmol/L (150 mg/dL) to reduce cardiovascular morbidity and mortality. These recommendations are based on a single, large RCT.
[..] For primary or secondary prevention, we recommend against the use of omega-3 fatty acids as a dietary supplement to reduce CVD risk. The evidence showed no effect of omega-3 supplements (ranging from 0.5 to >5 g/d) on cardiovascular mortality, composite cardiovascular events, MI, stroke, or all-cause mortality in studies ranging from 12 to 72 months.
[..] We strongly recommend against the use of niacin in prescription or supplement doses, alone or in combination with statins, for primary or secondary prevention because of increased adverse events and lack of CVD risk reduction.
We recommend against adding fibrates to statin therapy for either primary or secondary prevention, on the basis of evidence of adverse effects (elevated liver aminotransferase and creatinine levels and a possible increase in CVD risk in women) and no known benefit. However, because of the lack of robust evidence, this recommendation was graded as weak.”
[From the accompanying editorial]
“Taken as a whole, the guideline offers an approach to managing dyslipidemia that is practical, reflects evidence from large clinical trials, and is based on an unambiguous end point: CVD mortality. If universally applied to a large health care system, such as the VA/DoD, this approach would probably result in better outcomes, in relatively short order and at great efficiency. It is easy to see why the VA/DoD would embrace this approach.
That said, the VA/DoD dyslipidemia guideline differs sharply from European Society of Cardiology, Canadian Cardiovascular Society, and American College of Cardiology/American Heart Association (ACC/AHA) guidance, most notably in the approach to risk reduction in the secondary prevention arena; the latter guidelines recommend high-intensity statin therapy aimed toward percentage reduction from baseline LDL-C or LDL-C targets. The difference seems to hinge on the other guideline committees placing more importance on the decrease in major vascular events seen with high-intensity (vs. moderate-intensity) statin therapy and being less concerned about the potential adverse effects of these drugs.
Using cardiovascular mortality as the criterion for judging the effectiveness of an intervention is appealing. It allows us to directly compare trials from the same era or from one era to another without worrying that an improvement in outcome might reflect a difference in the way a softer end point, such as nonfatal myocardial infarction, is measured (creatine kinase vs. troponin levels). However, it is unlikely that we will ever have a trial that directly addresses the VA/DoD working group’s concerns about the effect of high-intensity statin therapy on mortality. The other guideline committees, mindful of the strong relationship between cardiovascular events and LDL-C levels, have chosen to value the wealth of evidence suggesting that high-intensity statin therapy prevents major vascular events, with a slight increase in myopathy. This view seems reasonable given the relatively low cost and low risk associated with high-intensity statin therapy.”
Management of Dyslipidemia for Cardiovascular Disease Risk Reduction: Synopsis of the 2020 Updated U.S. Department of Veterans Affairs and U.S. Department of Defense Clinical Practice Guideline O’Malley PG, Arnold MJ, Kelley C et al. Annals of Internal Medicine 2020.9.22
“Despite their ubiquity, there is limited evidence for the efficacy of smartphone applications for smoking cessation, to our knowledge. A 2019 Cochrane review included only 5 randomized trials testing the efficacy of smoking cessation smartphone applications, all of which were compared with lower-intensity cessation interventions (ie, lower-intensity application or nonapplication with minimal support). These applications, which were based mainly on the US Clinical Practice Guidelines (USCPG), had modest abstinence rates at the 6-month follow-up (eg, self-reported rates ranged from 4% to 18%). Overall, there was no evidence that smartphone applications improved the likelihood of smoking cessation (relative risk, 1.00; 95% CI, 0.66-1.52; I2 = 59%; 3079 participants). The Cochrane review called for rigorous randomized trials of smartphone applications for smoking cessation, and we see room for substantial improvement in the abstinence rates achieved with the use of these applications.
[..] Participants were recruited online, were randomized, and completed follow-up surveys at 3, 6, and 12 months after randomization. The 12-month primary end point accounted for the high relapse rates that commonly occur by 12 months.
[..] Because enrollment occurred online, additional actions were taken to ensure that enrollees were eligible, including CAPTCHA (Completely Automated Public Turing test to tell Computers and Humans Apart) authentication, review of IP (internet protocol) addresses for duplicates or non-US origin, and review of survey logs for suspicious response times (<90 seconds to complete the screening or <10 minutes to complete the baseline survey). In suspicious cases, participants were contacted by staff. If participants’ information could not be confirmed (n = 68), they were not enrolled.
[..] participants were randomly assigned in a 1:1 manner to either iCanQuit or QuitGuide using randomly permuted blocks of size 2, 4, and 6, stratified by daily smoking frequency (≤20 vs ≥21 cigarettes per day), educational level (high school or less vs some college or more), race/ethnicity (minority race/ethnicity vs non-Hispanic White), and results of depression screening (Center for Epidemiological Studies Depression Scale score ≤15 vs ≥16).
[..] iCanQuit (version 1.2.1; released 2017) teaches ACT skills for coping with smoking urges, staying motivated, and preventing relapse. After setting up a personalized quit plan in which users can learn about US Food and Drug Administration–approved cessation medications that they can obtain on their own, users are taken to the home screen, where they can progress through 8 levels of the intervention content, receive on-demand help in coping with smoking urges, track the daily number of cigarettes smoked, and track how many urges they let pass without smoking. The program is self-paced, and content is unlocked in a sequential manner. For the first 4 levels, exercises are unlocked immediately after the prior exercise is complete. For the last 4 levels, the next level will not unlock until users record 7 consecutive smoke-free days. If a participant lapses (eg, records having smoked a cigarette), the program encourages (but does not require) them to set a new quit date and return to the first 4 levels for preparation. iCanQuit is a research application created for this randomized clinical trial, and its content is not yet available to the public.
[From the study protocol]
| Conceptual level | Acceptance and Commitment Therapy | US Clinical Practice Guidelines |
|---|---|---|
| Philosophical basis | Functional contextualism: One’s current and historical context influence all of the one’s external (e.g., walking) and internal (e.g., urges, thinking) behavior. The standard for determining whether a behavior needs to be changed is whether it is functional: pragmatic, useful, or helps one obtain a goal. | Critical rationalism: Knowledge has an objective truth. Knowledge can only be gained by attempting to validate beliefs that are derived from theories. (While not based on a specific philosophy, Critical Rationalism is arguably consistent with USCPG skills training). |
| Theoretical basis | Rational frame theory: Overt environmental , cognitive, physiological, & emotional stimuli can be related to one another—and thereby take on each other’s qualities & functions—in every imaginable way: (Example: seeing an actual cigarette ← → thought “urge” ← → physical urge ← → smoking a cigarette). Trying to control these processes just adds new relations and interferes with behavior change (Example: distraction from an urge ← → more urges). In contrast, increasing willingness to experience (and not change) these processes increases value-guided behavior change. | Information processing theories: The mind processes information through the application of mental rules/strategies that guide behavior. Applying Illogical rules/strategies leads to dysfunctional behavior. (Example: Applying the illogical belief that “smoking controls stress” will lead one to smoke.) In contrast, applying logical rules/strategies leads to more effective information processing and functional behavior. |
| General approach to intervening on urges, emotions, and thoughts that cue smoking | Acceptance: Openness to experience urges, emotions, and thoughts as they are and without any intent that they change (e.g., no desire that urge reduces). Example: Asking: “How willing are you to have, and not try to change, your urges to smoke?” | Avoidance: Actively trying not to experience urges, emotions, & thoughts with the intent that that they change (e.g., desire for urge to reduce). Example: Asking: “How can you avoid or control your urges to smoke?” |
| Specific approach to intervening on urges and emotions that cue smoking | Being present: Being fully aware of the present moment with openness, interest, and receptiveness. Observation and non-judgmental description of experiences in the present moment. Example: while holding an unlit cigarette, take one minute to describe out loud its color, length, texture, smell. Next, describe in the present tense what urges and emotions come up. | Urge/emotion coping skills: A broad set of strategies designed to manage or control urges and emotions that cue smoking. Examples: avoiding places where you often smoke; engaging in a distracting activity (e.g., crossword puzzle); keeping hands active (e.g., gripping a stress ball); sucking on a hard candy. |
| Specific approach to intervening on thoughts that cue smoking | Cognitive defusion: Stepping back from the process of thinking. Recognizing thoughts, self-judgments, and memories as just words and pictures. Allowing them to come and go without trying to control or avoid them. Example: For a thought that often cues smoking (e.g., “I want to smoke.”), reduce it to one key word (e.g. “smoke”) and then say the word out loud repeatedly for 30 seconds. | Cognitive restructuring: A method of changing the content of one’s unrealistic/irrational beliefs and/or replacing them with realistic/rational beliefs. Example: Change the thought “Smoking is how I cope with things” with this response: “Smoking does nothing to help a smoker cope, other than relieving withdrawal.” |
| Specific approach to increase motivation to quit smoking | Values: Chosen life directions that guide actions. Values require no reasoning. Valuing is a process, not a life goal achieved or an outcome. Examples: “What really really matters to you?; How could quitting smoking be driven by the things that matter to you?” | Reasons to change: The specific expectations one would have for when a behavior has changed. Examining the advantages and disadvantages of a behavior change. Examples: Listing expected benefits of quitting smoking; Listing all of the reasons for quitting and for not quitting smoking. |
[end of study protocol excerpt]
[..] the full analyzable sample was 2415 (1214 in the iCanQuit group and 1201 in the QuitGuide group). The follow-up data retention rates were 86.7% (2093 of 2415) overall at 3 months (iCanQuit, 85.9% [1043 of 1214] vs QuitGuide, 87.4% [1050 of 1201]; P = .20) [..] and 87.2% (2107 of 2415) overall at 12 months (iCanQuit, 85.7% [1040 of 1214] vs QuitGuide, 88.8% [1067 of 1201]; P = .02]).
[..] For the primary outcome of 30-day PPA [point prevalence abstinence] at the 12-month follow-up, iCanQuit participants had 1.49 times higher odds of quitting smoking compared with QuitGuide participants (28.2% [293 of 1040] vs 21.1% [225 of 1067]; odds ratio [OR], 1.49; 95% CI, 1.22-1.83); prolonged abstinence at the 12-month follow-up (OR, 2.00; 95% CI, 1.45-2.76), abstinence from all tobacco products (including e-cigarettes) at the 12-month follow-up (OR, 1.60; 95% CI, 1.28-1.99).”
Efficacy of Smartphone Applications for Smoking Cessation: A Randomized Clinical Trial Bricker JB, Watson NL, Mull KE et al. JAMA Internal Medicine 2020.9.21
“as quality measures proliferate and we deepen our understanding of their role in learning health care systems, quality measurement simultaneously overwhelms us. Clinicians, payers, and policymakers bemoan the burden of measurement. A 2016 study estimated that 785 hours per physician and more than $15.4 billion across 4 specialties are spent annually reporting quality measures.
[..] As the cacophony of measurement increases, simplicity is appealing. Yet, patients and other stakeholders might assume that a composite measure reflects the totality of care delivered within an organization. Given the amount of clinical practice variation at the individual clinician level, an overall system rating could serve as false reassurance to a patient receiving care if it does not reflect the care provided by that patient’s clinicians.
[..] Any composite measure, even if intended for use mainly by payers, should be transparent and able to be deconstructed to understand how best to promote clinical excellence. This has been shown in recent efforts to construct composite measures for adult vaccination.
[..] As value-based payments continue to push clinicians into various risk arrangements, payers should consider composite measures to evaluate these arrangements. Convening groups, such as the National Quality Forum, may also want to consider how best to test a composite measure for discrete domains, such as prevention- or disease-specific management, as it goes through the approval process. Finally, we must continue to push our infrastructural investments in the essentials of quality measurement and improvement beginning with health information technology. We need to invest in technology that facilitates measurement and integration with advanced payment models. We must also make meaningful investments in human capital to infuse a culture of quality and safety into all health care roles from leadership to patients.”
For the Love of Quality Patel KK. Annals of Internal Medicine 2020.9.22
2020.9.20
“The patient’s care context can refer to information about his/her health and care (eg, a patient reports that a symptom is getting worse) or the clinician’s interpretations and decisions (eg, current regimen was discontinued because the patient failed antibiotics). An EHR’s [electronic health record’s] inability to represent such information is due, in part, to the fact that the problem-oriented structure of most EHRs does not require explicit statements about care decisions, or what Cimino defines as the “why” in the EHR. For example, a treatment can be linked to a problem, indicating that it was chosen to treat the problem, but the underlying reason behind this decision (eg, “why” this particular treatment was chosen) is not captured. We believe that if such information was routinely captured (in computable form, as well as modeled, structured, and coded), it could be used to inform better navigation, CDS [clinical decision support], and data entry. We hypothesize that a formalism with linkages among clinical concepts, or semantic relationships, would be useful to represent patients’ care contexts as a semantic network of subject-predicate-object tuples.
[..] although most published ontologies contain relationships useful for CDS, they do not always provide relationships suitable for representing patients’ care context.
[..] The formal representation of patients’ care context has already been proposed with the use of relationships found in terminologies such as SNOMED CT. Although SNOMED CT covers relationships of medical knowledge inferences (eg, sinusitis-is_a-disorder of nasal sinus), it does not provide relationships that represent the context surrounding a patient’s care (eg, amoxicillin [for a particular patient]-has_reason-allergic to ciprofloxacin). Such a representation has also been proposed with the use of clinical element models but has not, to our knowledge, been implemented. The concepts and relationships identified can inform the development of formal knowledge representation schemas with normalization to the UMLS Concept Unique Identifiers, thus increasing their generalizability and application for EHR development.
[..] 459 (73%) sentences were annotated with only 25 (30%) tuples, indicating that with a relatively small combination of concepts and relationships, one can formally represent situations commonly found in clinical encounters, such as interventions ordered (81 instances), findings/conditions present (71 instances), or the intention to start an intervention (69 instances). Although the most used relationships came from the literature, our annotations still produced 31 (65%) new relationships, indicating that specific information reported in clinical notes or spoken communications has not been covered by previous studies.
We do not expect that clinicians or domain experts will have to manually create these tuples upfront. Rather, they are intended to be the foundation of a data infrastructure to improve the EHR. We envision a next-generation EHR capable of processing the patient’s care context, represented as a collection of tuples added to what we defined as a patient-specific knowledge base (PSKB). In order to fulfill this vision, some practical, near-term steps for which our starter set of tuples is useful can be performed to build the foundation for more complex, long-term steps to improve EHR functions. The first step involves the creation of a formal ontology representing our classes and relationships, which could be done by applying a widely implemented formalism, such as the Ontology Web Language Description Logic; however, the most adequate formalism will likely be defined through the evolution of our starter set of tuples in future studies. As part of this process, normalization to UMLS Concept Unique Identifiers can be performed and sub-classes and modifiers that have not been defined but are implicitly represented in our tuples can be created. Also during this process, our current guidelines can be expanded to cover these additional items, allowing expansion of the ontology to cover other potential contextual elements and relationships to increase the dimensionality of our schema, which needs to be tested in future empirical studies. Next, the application of the ontology can be tested with a practical use case, such as the creation of a semantic record navigation, with a PSKB populated with a combination of natural language processing and manual chart review. The hypothesis to be tested is that such a solution would be preferred by clinicians when compared to current navigation patterns that require clinicians to access data through isolated EHR components, or to manually find and read bloated notes that frequently contain redundant information and errors. For example, to verify why a medication was ordered for a patient, a clinician could access a network of concepts linked to the medication (ie, the medication knowledge graph) and navigate to other parts of the record (eg, to notes mentioning the reason for ordering it). Similar knowledge representation has been successfully applied to other informatics solutions and is commonly used in other industries. Although some assertions of the knowledge graph might change over time (eg, patient has pain in 1 visit which has resolved in another), each assertion will have a time stamp in the knowledge base, which can potentially be used to verify when a new assertion negates a previous assertion; however, this hypothesis needs be tested in future studies.
Once the ontology has been created, expanded, and validated, another barrier to implementing this vision needs to be overcome: the need to continuously populate a PSKB in real clinical scenarios. This is challenging because clinicians are the only ones who can tell what they are thinking about the patients’ problems, and they are already burdened with EHR-associated documentation. However, the current challenge may become a future opportunity, which leads us to the potential long-term applications of our schema to improve EHR functions. As demonstrated by our transcript annotations, most concepts documented in visit notes tend to be verbally communicated during a visit; although sometimes this commutation uses informal language (eg, “nosebleed” as opposed to “epistaxis”), with the use of a formal ontology these terms could be converted into structured, coded concepts. Based on recent breakthroughs of conversational speech recognition, the accurate transcription of spoken communications will likely be accessible in the near future, allowing the application of a PKSB to improve data entry at the point of care. With proper translation methods, an ontology of patients’ care context could be parsed by natural language processing systems for concept extraction and other modern language understanding methods for relation classification, forming the data infrastructure for capturing tuples from real-time transcripts of clinical visits. Contextual concepts not represented in standard terminologies (eg, a finding described as “room spinning sensation”) could be classified into an appropriate concept class (eg, value) and added to the PSKB. Coded concepts communicated during a visit could be used to facilitate structured data entry with either a single click (for items explicitly defined: Azithromycin, by mouth, once a day for 5 days) or 2 clicks (for items not defined: Azithromycin); the latter will demand an additional click to select the exact order. Furthermore, this infrastructure could be used to create content for narrative note sections. This could be done by combining standard sentences describing information commonly communicated in clinical notes with information represented in the PSKB or extracted from the patient’s record. For example, the sentence “Patient is a [Age] [gender] who presents for [type of visit] with [reason for visit]” could be converted into “Patient is a 45-year-old female who presents for new patient visit with acute bronchitis.” Likewise, other sentences needed to populate HPI and AP sections could be automatically generated as new information is added to the PSKB. Information relevant for the note but not verbalized during a visit could be extracted from the patient’s record (eg, visit type, referring physician) or prepopulated automatically (eg, standard patient education sentences). As the clinicians realize the benefits of this infrastructure, they can be trained to “think aloud” and verbalize as a many reasoning elements as possible. In addition to facilitating structured and narrative data entry at the point of care, this infrastructure would automatically populate a PSKB and, as more context is added to the knowledge base through new visits and other sources (eg, notes, problem lists, lab results), the PSKB would continuously capture the patient’s care context to empower several EHR functions in a continuous improvement cycle. Examples of long-term improvements that can be obtained from this data infrastructure include learning health systems capable of processing contextual elements in analyses of large-scale data sets and more accurate CDS systems to potentially mitigate the infamous alert fatigue. Imagine CDS systems capable of processing a patient’s care context (eg, patient’s symptoms are getting worse), and when a clinician orders a new chest x-ray (to compare with a previous test from 3 days ago), the system identifies that the frequently overridden alert asking the clinician to consider not ordering the same test within 3 days does not need to be fired (because now its logic can process the reason behind the clinician’s decision: patient’s symptoms worse; no alert needed!).”
Formal representation of patients’ care context data: the path to improving the electronic health record Colicchio TK, Dissanayake PI and Cimino JJ. JAMIA 2020.9.16
2020.9.18
“[..] The inadequacy of current digital identity solutions degrades security and privacy for all Americans, and next generation solutions are needed that improve both security and privacy.
Government entities, as authoritative issuers of identity in the United States, are uniquely positioned to deliver critical components that address deficiencies in our digital identity infrastructure and augment private sector digital identity and authentication solutions.
State governments are particularly well suited to play a role in enhancing digital identity solutions used by both the public and private sectors, given the role of State governments as the issuers of driver’s licenses and other identity documents commonly used today.
[..] It should be the policy of the Government to use the authorities and capabilities of the Government to enhance the security, reliability, privacy, and convenience of digital identity solutions that support and protect transactions between individuals, government entities, and businesses, and that enable Americans to prove who they are online.
IMPROVING DIGITAL IDENTITY TASK FORCE
There is established in the Executive Office of the President a task force to be known as the ‘‘Improving Digital Identity Task Force’’ (in this section referred to as the ‘‘Task Force’’).
[The bill outlines the Task Force membership including multiple cabinet members, the Director of the National Institute of Standards and Technology, five state government officials including congressional appointees, and five local government officials.]
The Task Force shall
- identify Federal, State, and local agencies that issue identity information or hold information related to identifying an individual;
- assess restrictions with respect to the abilities of such agencies to verify identity information for other agencies and for nongovernmental organizations;
- assess any necessary changes in statute, regulation, or policy to address any restrictions determined under paragraph (2);
- recommend a standards-based architecture to enable agencies to provide services related to digital identity verification in a way that is secure, protects privacy, and is rooted in consumer consent;
- identify funding or resources needed to support such agencies that provide digital identity verification, including a recommendation with respect to additional funding required for the grant program under section 5 [see below];
- determine whether it would be practicable for such agencies to use a fee-based model to provide digital identity verification to private sector entities;
- determine if any additional steps are nec5 essary with respect to Federal, State, and local agencies to improve digital identity verification and management processes for the purpose of enhancing the security, reliability, privacy, and convenience of digital identity solutions that support and protect transactions between individuals, government entities, and businesses;
- assess risks related to potential criminal exploitation of digital identity verification services; and
- to the extent practicable, seek input from and collaborate with interested parties in the private sector to carry out the purpose under subsection (b).
DIGITAL IDENTITY STANDARDS
[..] The Director of the National Institute of Standards and Technology (in this section referred to as the ‘‘Director’’) shall develop a framework of standards, methodologies, procedures, and processes (in this section referred to as the ‘‘Framework’’) as a guide for Federal, State, and local governments to follow when providing services related to digital identity verification.
[..] In developing the Framework, the Director shall consider—(1) methods to protect the privacy of individuals; (2) security needs; and (3) the needs of potential end-users and individuals that will use services related to digital identity verification.
DIGITAL IDENTITY INNOVATION GRANTS
[..] Not later than 18 months after the date of the enactment of this Act, the Secretary of Homeland Security (in this section referred to as the ‘‘Secretary’’) shall award grants to States to upgrade systems that provide drivers’ licenses or other types of identity credentials to support the development of highly secure, interoperable State systems that enable digital identity verification.
SECURITY ENHANCEMENTS TO FEDERAL SYSTEMS
[..] Not later than 6 months after the date of the enactment of this Act, the Secretary of Homeland Security shall issue binding operational directives to Federal agencies for purpose of implementing—(1) the guidelines published by the National Institute of Standards and Technology in ‘‘Special Publication 800-63’’ (commonly referred to as the ‘‘Digital Identity Guidelines’’); and (2) the memorandum of the Office of Management and Budget issued on May 21, 2019, which includes the subject ‘‘Enabling Mission Delivery through Improved Identity, Credential, and Access Management’’.”
The bill (H.R. 8215) was referred to three House Committees: Oversight and Reform; Science, Space, and Technology; and Ways and Means.
Improving Digital Identity Act of 2020 Foster B, House of Representatives Bill for the 2nd session of the 116th Congress, 2020.9.11
“we have identified best practices for communicating public health information democratically. We have drawn our principles and recommendations from in-depth studies of nine countries and two provinces on five continents. The jurisdictions are Senegal, South Korea, Taiwan, Germany, New Zealand, Norway, Sweden, Denmark, and Canada (for which we also studied two provinces, British Columbia and Ontario). Each of these cases managed relatively effective Covid responses on their own terms; each of them also took the work of democratic communication seriously. Where appropriate, we draw comparisons with democracies that struggled to communicate around Covid-19, particularly the United Kingdom and the United States.
[..] This project is structured by two assumptions. First, health communications aligned with democratic norms and principles can improve compliance in democracies. Public health messaging ought to work with the political grain in a particular society, not against it. This also means that the RAPID principles explained below may be applied differently in specific political contexts, attuned to local democratic traditions and populations. Our second assumption is that a democratic response to Covid-19 can help populations feel more sovereign, bolstering rather than weakening democratic trust during a period of uncertainty and crisis. Recent mass demonstrations against mask-wearing in Europe and North America show that Covid compliance problems will continue to plague many democracies. Feelings of disenfranchisement and a lack of control or sovereignty are not far from the surface. Our RAPID principles are designed to address politicized public health challenges like these ones.
[..] The RAPID principles of democratic public health communications:
- Rely on autonomy, not orders
- Generate more widespread involvement and investment in the response beyond government decision-makers and public health officials;
- Encourage active habit-formation rather than passive obedience, for internalized reflexes and behaviours are likely to be more sustainable than external orders;
- Reduce confusion by avoiding an overlapping and increasingly granular set of orders and rules for particular daily behaviours; principles may carry over across stages of the pandemic, further streamlining public health messaging;
- Support mental health by maximizing citizens’ sense of personal agency and control during a challenging and uncertain time; and
- Reinforce the population’s democratic self-understanding and feeling of political efficacy by emphasizing responsibility, active participation, and shared citizenship; successes are credited not to authorities, but to collective action by individuals.
- Attend to values, emotions, and stories
- Pull in citizens and civil society
- Institutionalize communications
- Describe it democratically“
[..] To improve compliance, forestall fatigue, and support democratic health, governments should rely sparingly on explicit or enforced health directives. Instead, pandemic responses should emphasize autonomy where possible, in alignment with national traditions and local political cultures, supported by thoughtful and clear communications. Among the most effective Covid-19 responses analyzed here, two forms of autonomy were most salient: personal autonomy and institutional autonomy.
[..] Autonomy is not anarchy. Rather, jurisdictions that have integrated autonomy into their Covid-19 responses have combined the freedom to make individual and institutional decisions with a set of understandable and applicable principles: guidelines that citizens, businesses, and organizations can use to manage their behaviour and help them evaluate risks. These principles are communicated clearly and frequently. Rather than dedicating resources to developing orders for every possible circumstance (and establishing an expectation among citizens that authorities will do so), regions and countries that rely on autonomy expect individuals and organizations to make responsible judgments themselves.
[..] Relying on civic autonomy to readjust social behaviour during a pandemic (rather than specific orders) is a strategy with potential benefits for both public and democratic health. This strategy may:
[..] autonomy functions as a three-way trust generator. First, offering autonomy to citizens means trusting them to make responsible decisions. Policymakers extend trust to citizens. Second, citizens are encouraged to trust each other. Assuming relatively widespread compliance, individuals witness their neighbors making responsible, autonomous decisions to safeguard the community’s collective health. Governments can model trusting behaviour among citizens by stressing good faith and incomplete knowledge instead of shaming rulebreakers. Officials can model behaviours such as mask-wearing or self-isolating. Most importantly, governments can retain trust by ensuring that public figures face consequences when they contravene guidelines.
[..] Autonomy carries certain risks. Some individuals or businesses will inevitably take advantage of the freedom afforded them to behave in ways that threaten the public good. Governments may wish to calibrate the autonomy they provide during an emergency with existing levels of social trust and local political traditions. Crucially and counterintuitively, autonomy may increase compliance more effectively than heavy-handed enforcement, which can generate knee-jerk disagreement and long-term discontent. Enforcement will necessarily figure into any state’s Covid-19 strategy. But our comparative analysis indicates that it is valuable to adopt messaging strategies that assume widespread good faith, social trust, and responsible autonomous decision-making rather than communicating in ways that threaten enforcement or shame bad actors.
[..] A field epidemiology manual developed by the U.S. Centers for Disease Control and Prevention notes four factors that determine whether an audience will perceive a messenger as trusted and credible: empathy and caring; honesty and openness; dedication and commitment; and competence and expertise.
[..] There is no single best practice for how to do the work of values-framing, or who should be responsible. [..] What is important, however, is that someone repeatedly and carefully communicates how pandemic measures relate to existing social and political values. Health researchers, too, argue that we can better encourage widespread adoption of face masks, for example, by seeing them as a social practice buttressed by cultural values rather than framing them as a medical intervention.
Democratic Health Communications during Covid-19: A RAPID Response Tworek H, Beacock I and Ojo E. Vancouver: UBC Centre for the Study of Democratic Institutions, September 2020
2020.9.17
“Optimal pharmacologic therapy of heart failure with reduced ejection fraction (HFrEF) is carefully scripted by evidence-based treatment guidelines, but a large proportion of patients with chronic HFrEF either do not receive guideline-directed medical therapy (GDMT) or are underdosed in clinical practice. Dose titration of GDMT is also uncommon, particularly when patients do not report progressive symptoms.
[..] The primary study outcomes were the change from baseline to 3 months in the proportion of patients receiving the guideline-directed medications in each category and the proportion receiving GDMT at 50% or more of target doses, analyzed using a binomial test.
[..] Of 1131 patients who were initially eligible, 197 completed the 3-month follow-up in the remote intervention group (including 59 women [29.9%] and 34 Black individuals [17.3%]), and 831 patients (246 women [29.6%] and 88 Black individuals [10.6%]) whose physicians declined to participate in the intervention served as a usual-care reference group.
[..] Over a mean (SE) follow-up of 140.6 (6.2) days (with 34 patients completing less than 90 days), navigators made a mean (SE) of 8.6 (0.4) telephone calls per patient (mean [SE] time between contacts, 16.2 [1.2] days), spent a mean (SE) of 4.1 (0.3) cumulative hours with each patient, and made 794 medication adjustments (mean [SE], 4.0 [0.2] per patient). Adjustments included 165 changes in the dosing of ACE inhibitors, 104 changes in angiotensin-receptor blockers (ARBs), 76 changes in ARNIs, 331 changes in β-blockers, and 47 changes in mineralocorticoid receptor antagonists (MRAs). Of the 831 patients in the usual-care group, 482 (58.0%) had at least 1 encounter with a cardiologist during the study period.
[..] At 3 months, patients allocated to the remote intervention experienced significant increases from baseline in the use of renin-angiotensin system inhibitors (ACE inhibitors, ARBs, or ARNIs: 138 [70.1%] to 170 [86.3%]; P < .001) and β-blockers (152 [77.2%] to 181 [91.9%]; P < .001) but no change in the use of MRAs (51 [25.9%] to 60 [30.5%] P = .14). By comparison, no change from baseline was observed in the proportion of patients receiving any category of GDMT at 3 months in the usual-care group. The increase in renin-angiotensin system inhibitor and β-blocker use in the intervention group was greatest among patients followed up by general cardiologists, with smaller changes seen in the group followed up by HF specialists. The proportion of patients receiving GDMT at 50% or more of target dose at 3 months was also increased to a greater extent in patients allocated to the remote intervention, with little dose titration observed in the usual-care group. Key adverse events were similar between groups, except for worsening kidney function, which was more common in the remote intervention group (as measured by a rise in serum creatinine to >0.3 mg/dL: 18 [9.1%] vs 3 [0.4%]; P < .001).
In comparison with usual care over a 3-month period, an algorithm-driven, navigator-led remote medication optimization strategy improved both use of GDMT and titration of GDMT to target doses in patients with HFrEF. Remote drug titration was orchestrated with a low rate of adverse events without disruption of physician-patient relationships, with greater acceptance and efficacy among patients followed up by general cardiologists than in those followed up by HF specialists. This approach may represent a scalable, population-level strategy to close the gap between guidelines and implementation of GDMT in clinical practice.
[..] despite significant improvements in use of renin-angiotensin system antagonists and β-blockers, we did not observe similar improvements in the use of MRAs, perhaps as a consequence of the strict criteria used to assess MRA eligibility in this population, which had predominantly New York Heart Association I and II–level disease. [..] the overall study duration was insufficient to examine an association of the intervention with clinical outcomes.
[..] Our data suggest that many of the barriers to use of GDMT in clinical practice might be overcome at scale by engaging nonphysician personnel to supplement clinic-based follow-up and support the process of pharmacologic optimization. In the context of increasing emphasis on value-based care, costs associated with the personnel and infrastructure needed to support this approach must be considered against the potential long-term cost savings anticipated from reduced HF hospitalizations and increased life span as a consequence of greater use of appropriate pharmacologic therapy. Remote management by a centralized team might also help to expand access to specialty expertise, removing the constraints of resource limitations that may be prevalent in rural or underserved areas.”
Remote Optimization of Guideline-Directed Medical Therapy in Patients With Heart Failure With Reduced Ejection Fraction Desai AS, Maclean T, Blood AJ et al. JAMA Cardiology 2020.9.16
2020.9.16
“There are ways, with demonstrated effectiveness in real-world conditions, to address the constellation of afflictions known as NCDIs [non-communicable diseases and injuries]. We have found, however, that the world’s poorest billion are being systematically deprived of those life-saving and life-changing interventions. This unfair exclusion stems both from a lack of global solidarity with the poorest of the poor, and from inadequate descriptions and comprehension of the problem. NCDIs are commonly represented as complications of ageing and development. In fact, they also constitute a large and diverse burden of illness among children and young adults, who make up the largest proportion of people living in extreme poverty around the world. Public health discourse and global solutions have generally focused on preventing NCDIs through changes in human behaviours, and not on addressing the inadequate resources available for the poor to be properly nourished, live safely, and to access health care. Meanwhile, treatments for NCDIs account for the largest gap in health financing for LLMICs [lower-middle-income countries], making a mockery of international commitments to universal health coverage (UHC).
[..] the WHO Global Action Plans for non-communicable diseases (NCDs) focused initially on four major disease categories (cardiovascular disease, diabetes, chronic respiratory disease, and cancer) and four groups of associated risk factors (unhealthy diets, physical inactivity, tobacco use, and harmful use of alcohol), known as the 4 × 4 conditions. These are undoubtedly global concerns, but leave out key NCDI priorities for the poorest billion.
[..] More than 90% of the poorest billion live in rural areas of LLMICs in sub-Saharan Africa and South Asia. More than half a billion people will probably still be living in extreme poverty until 2030. Some projections range as high as 1 billion, taking account of the adverse impact of climate change and inequalities in the distribution of economic growth. The COVID-19 pandemic is now pushing projections of extreme poverty even higher. The World Bank estimates that the pandemic will drive between 71 million and 100 million people into extreme poverty, 81% of them in sub-Saharan Africa and South Asia—the regions that are already home to more than 90% of the world’s poorest billion people.28 Around 80% of the poorest billion are aged younger than 40 years, and around 90% are younger than 55 years. Our analysis shows that NCDIs in these populations are due to a diverse set of conditions and risks. Notably, these conditions are heterogeneous in their effect on the lifetime health of those affected. Those NCDIs associated with the greatest health loss among the poorest billion result in the loss of 20 more years of healthy life per person than the same conditions in high-income populations. Much of this is because NCDIs among the poorest are acquired at younger ages (partly due to population age structure) and because NCDIs are more lethal when they occur among those living in extreme poverty with low access to quality health services.
[..] we developed a framework for scoring each of the identified NCDI health-sector interventions from the perspective of cost-effectiveness and equity, and identified interventions that are comparable to other global health priorities in both these dimensions.”
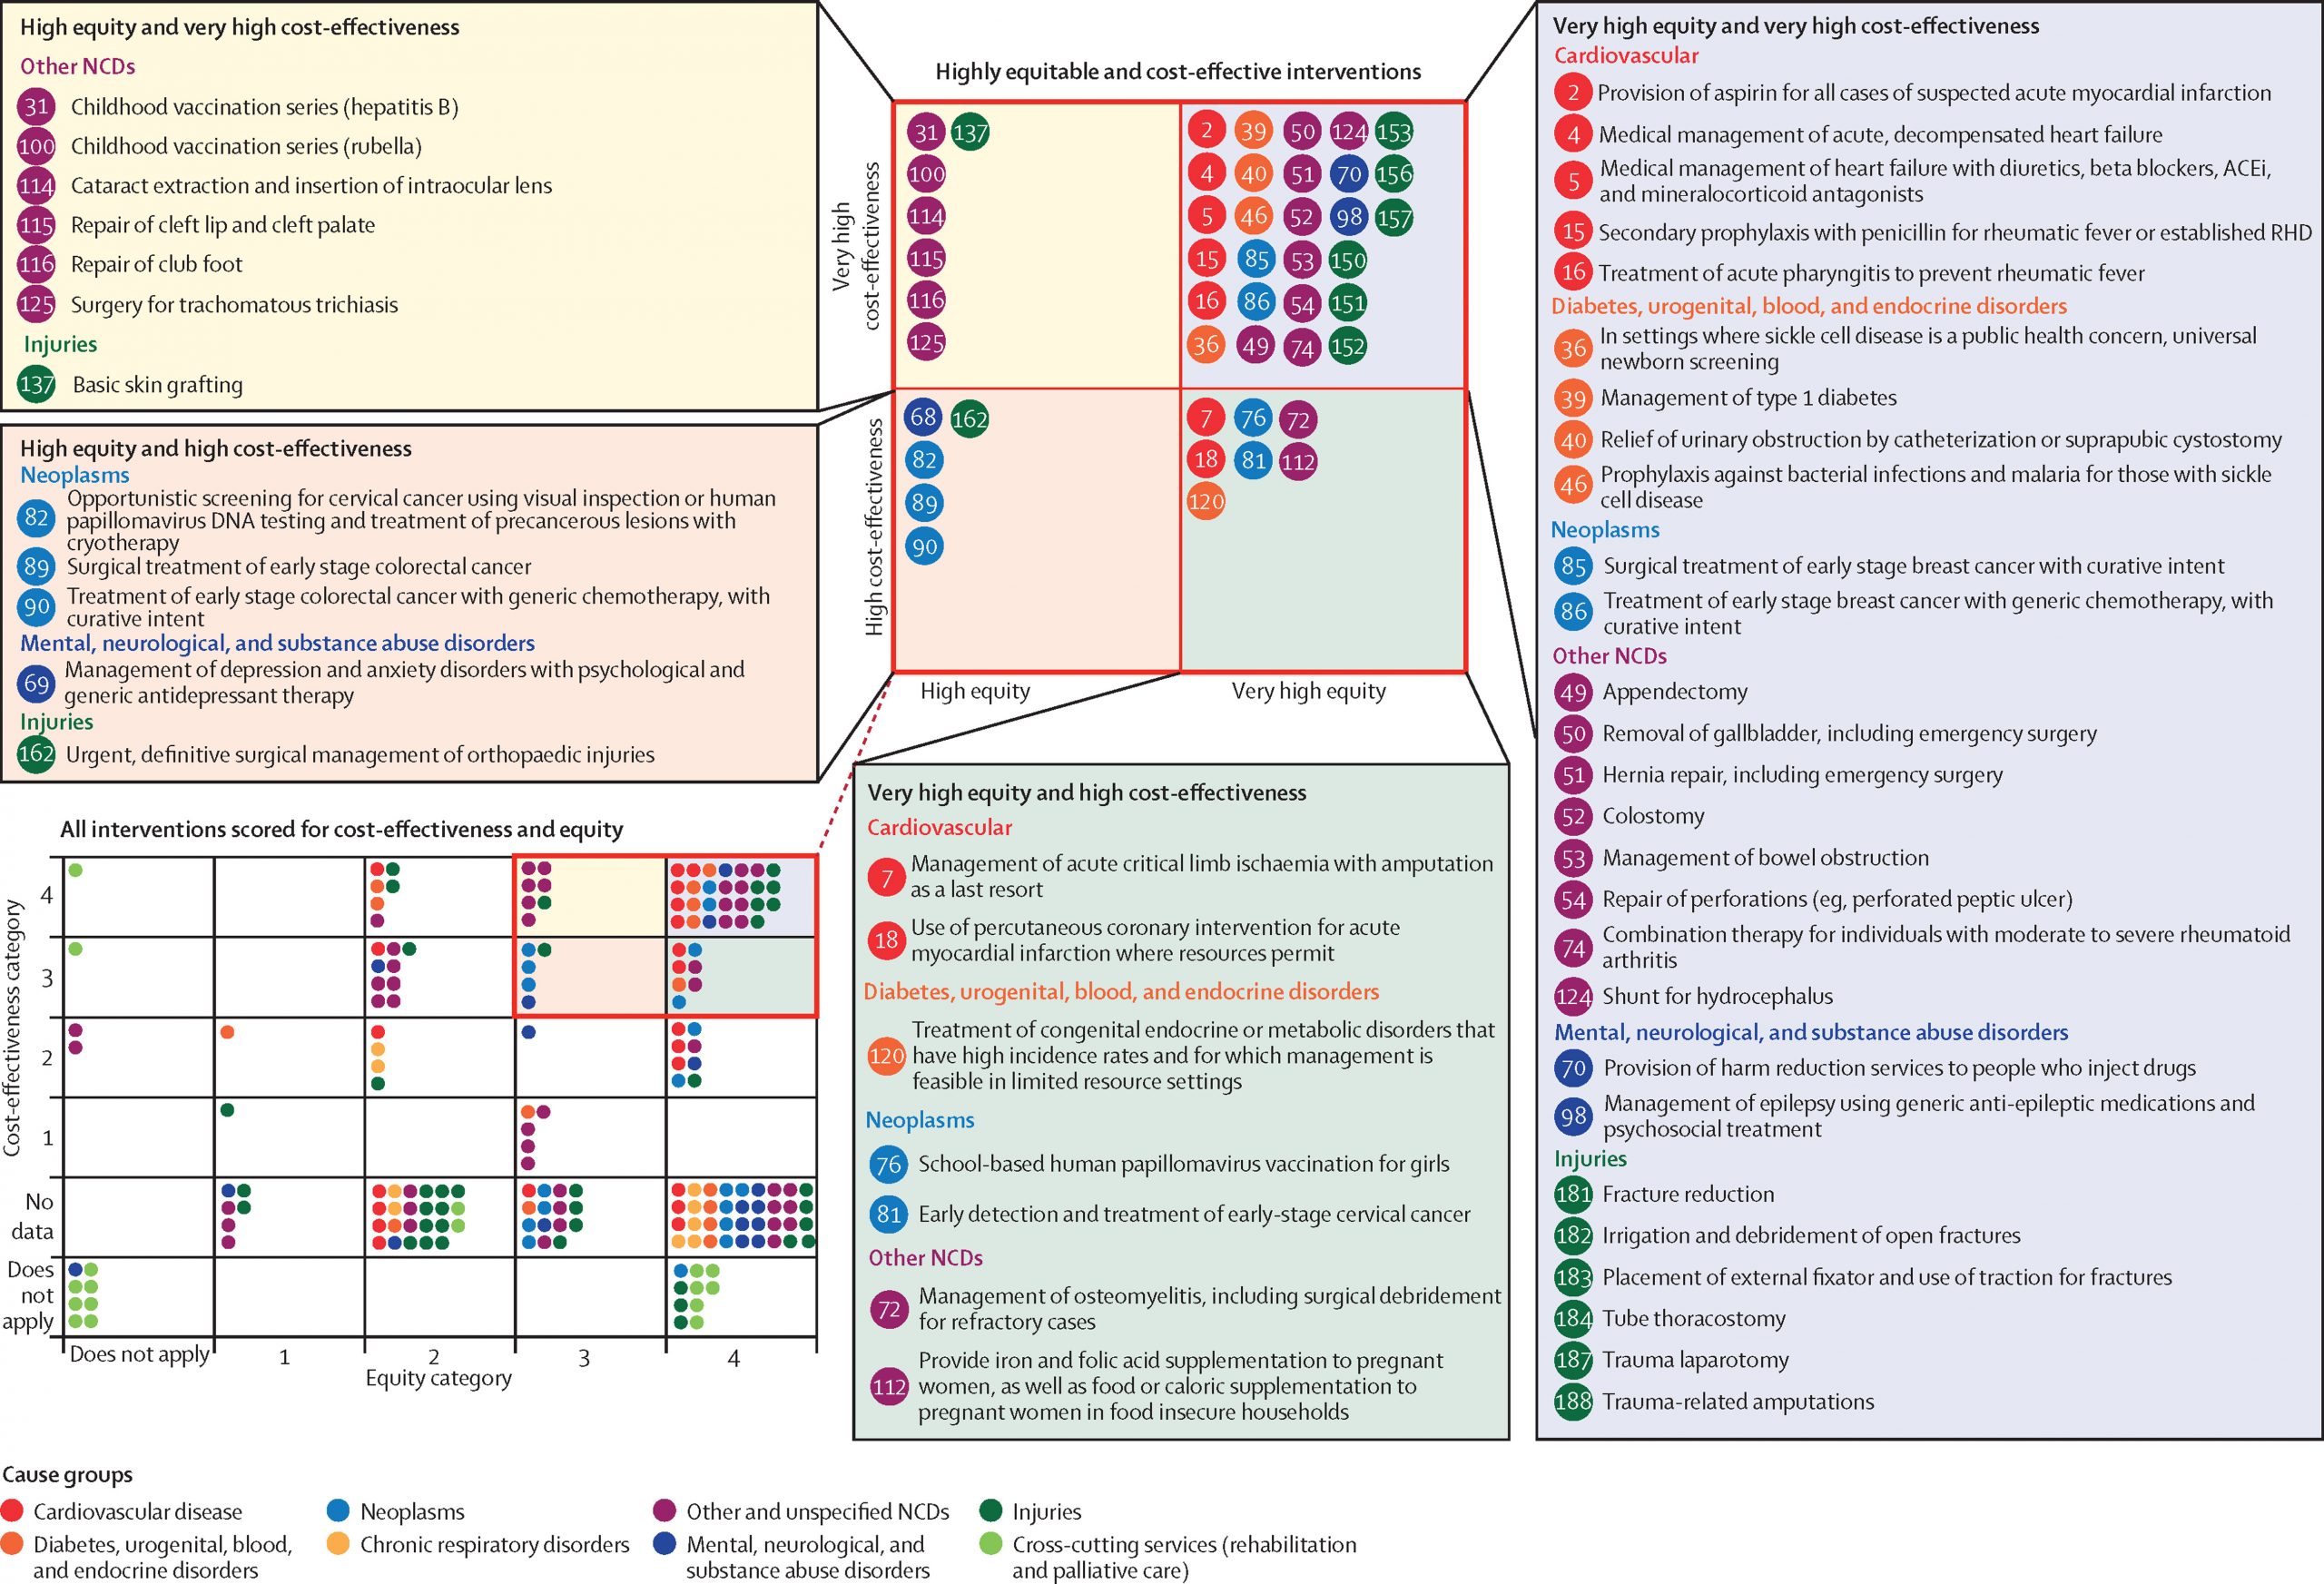
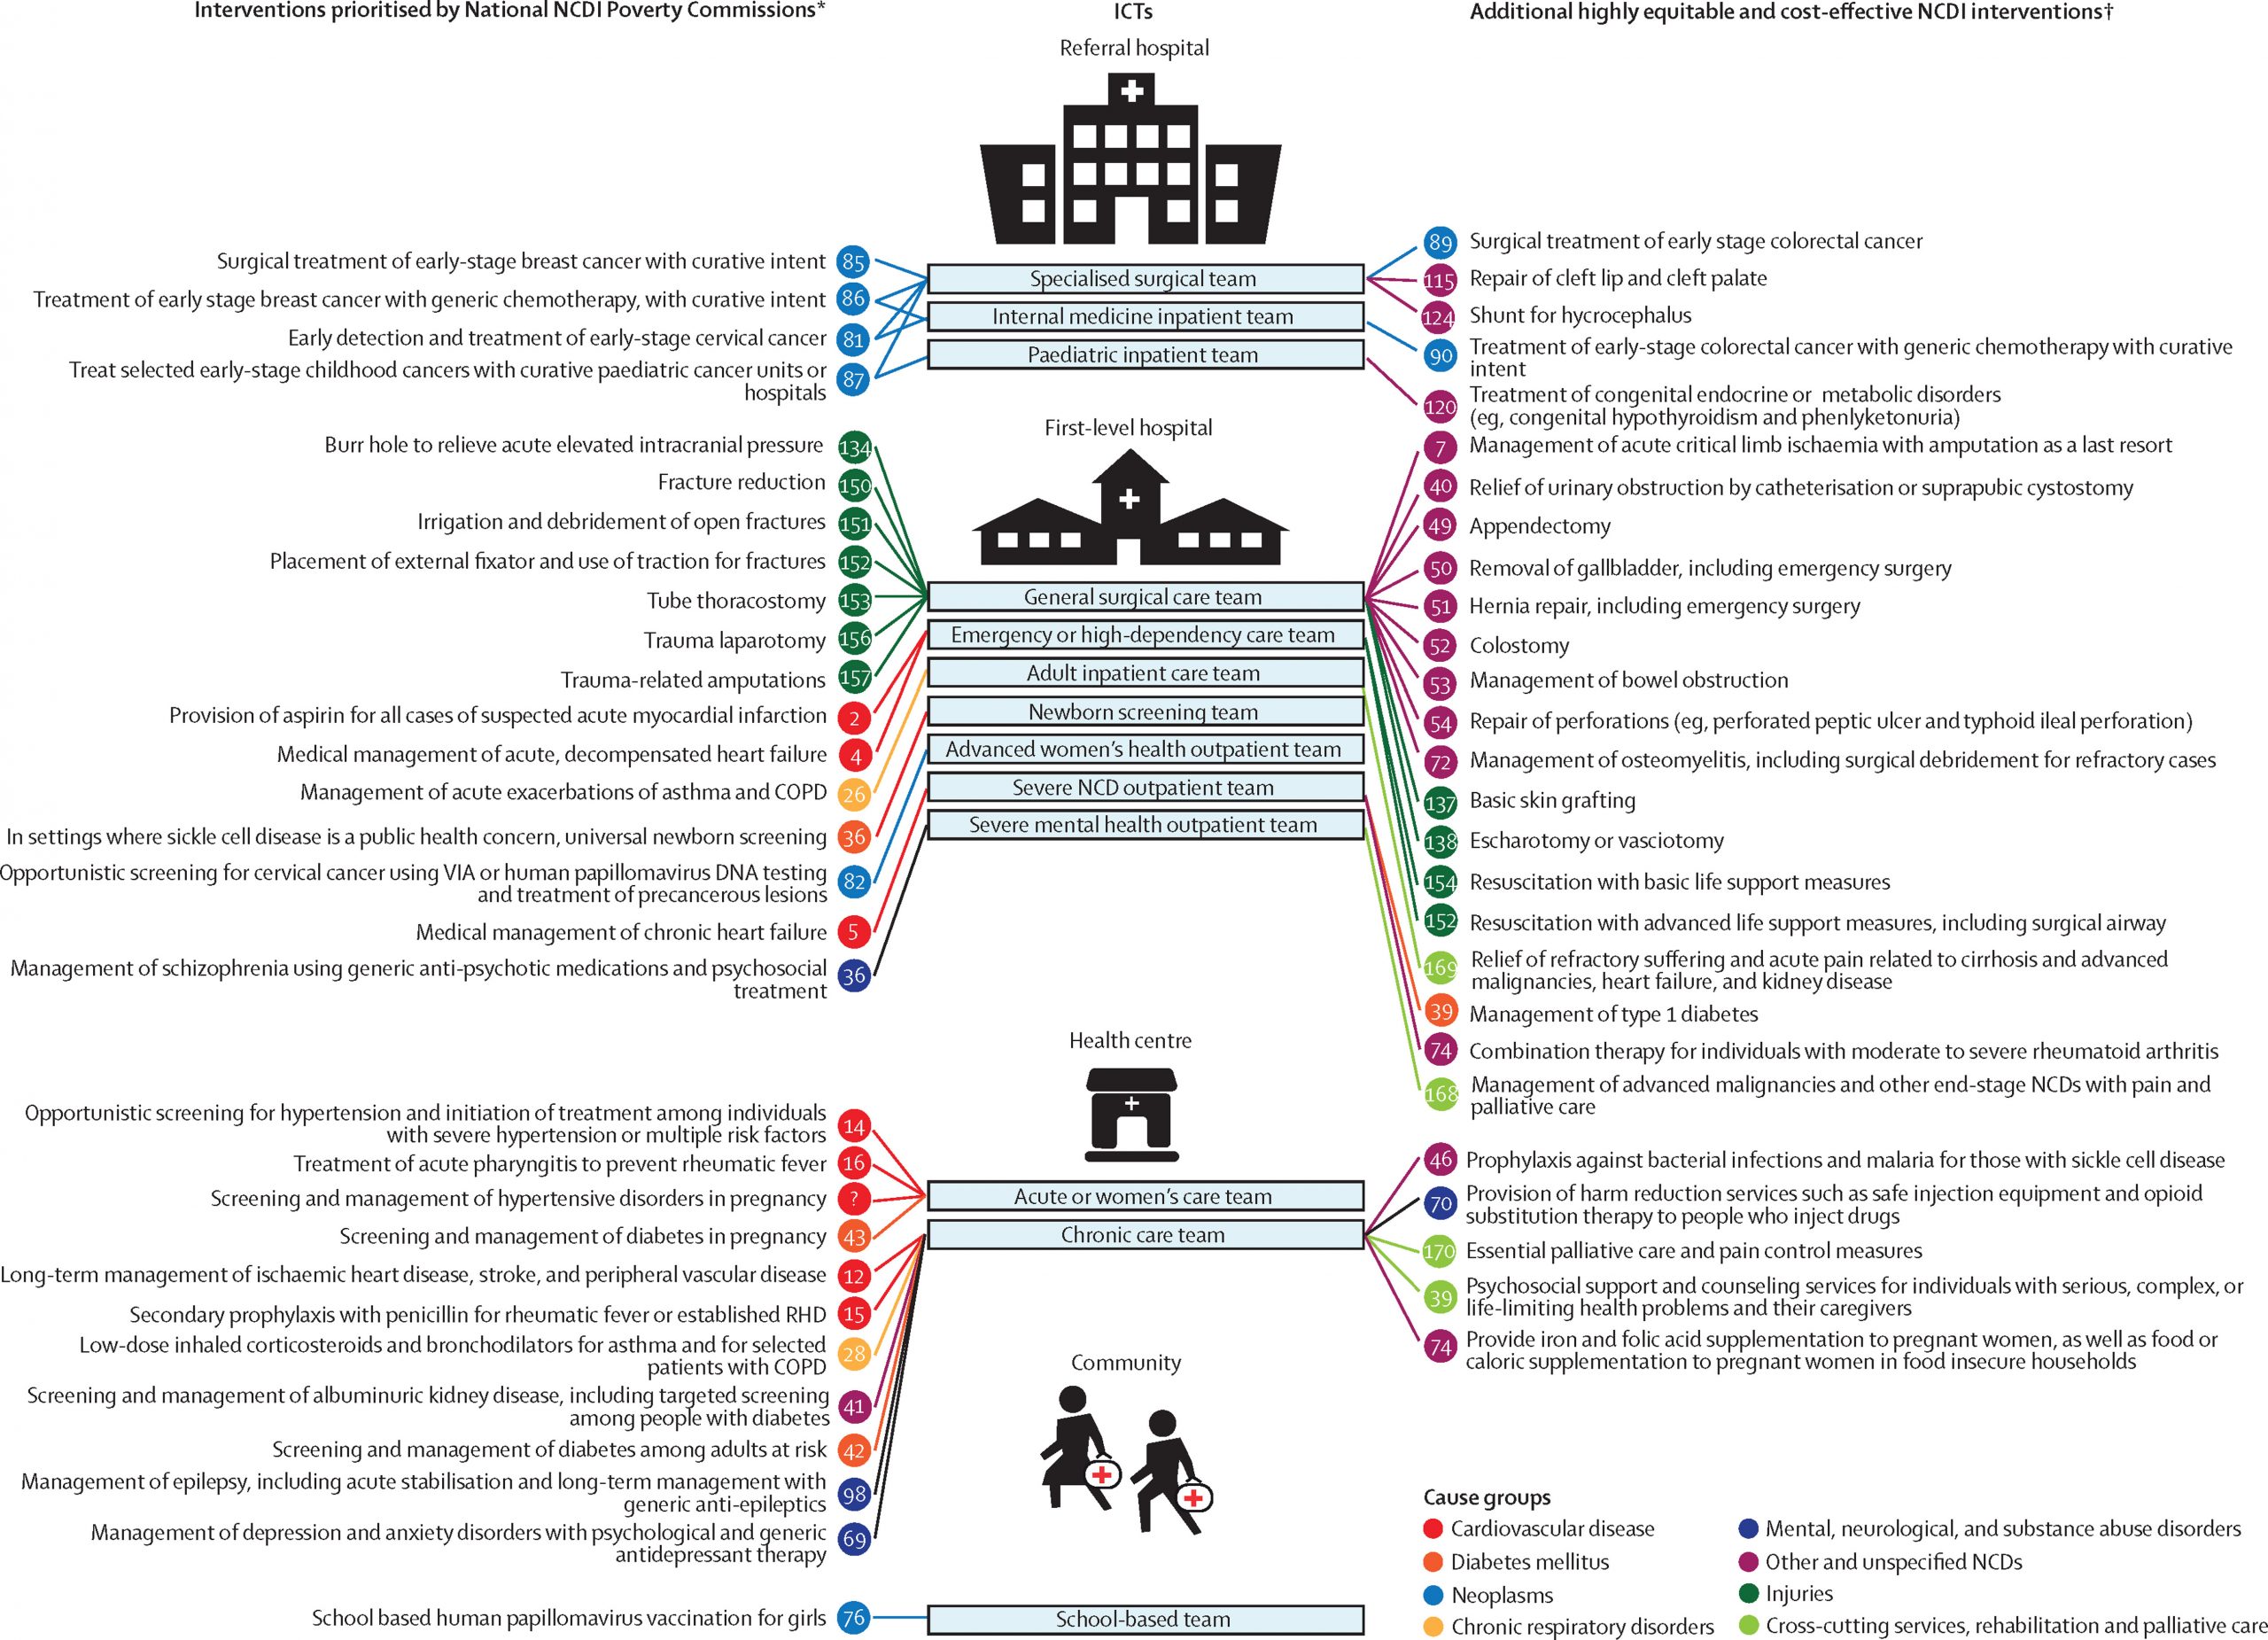
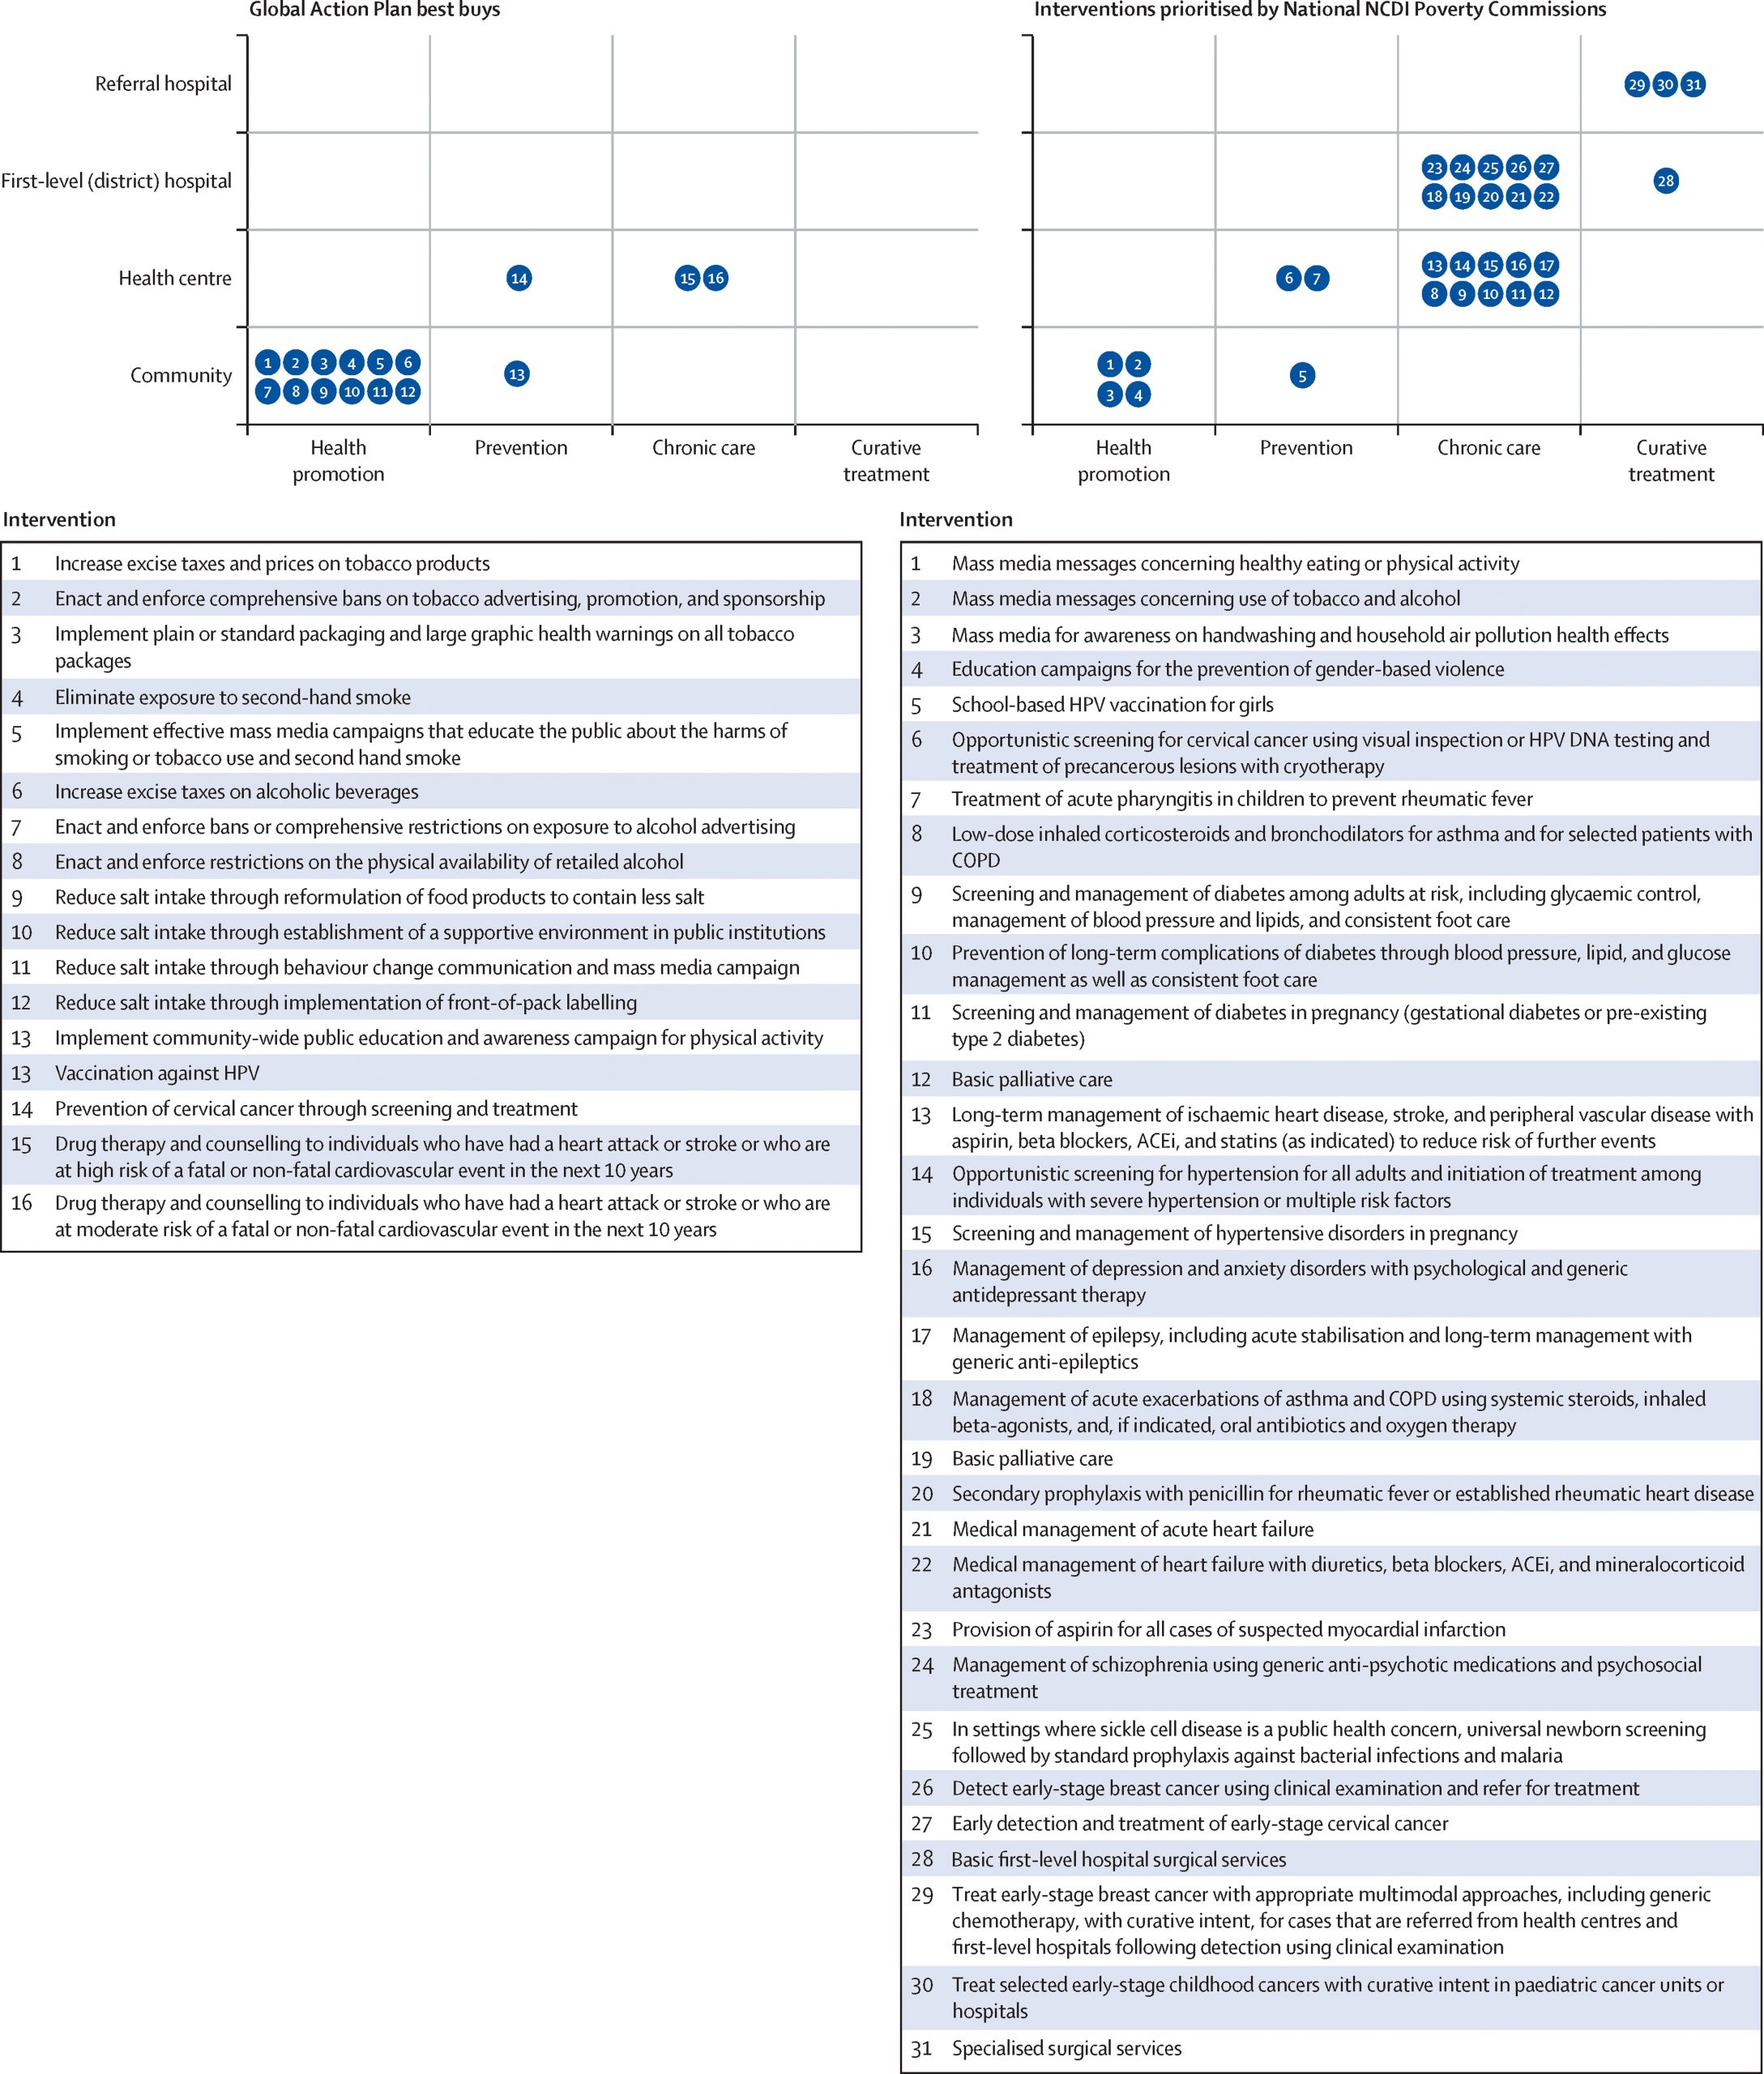
The Lancet NCDI Poverty Commission: bridging a gap in universal health care coverage for the poorest billion Bukhman G, Mocumbi AO, Atun R et al. The Lancet 2020.9.14
“Several surveys track Americans’ views about the health care system, but they don’t generally capture the extent of agreement about these fundamental trade-offs. To help illuminate where Americans might agree or diverge on fundamental reform issues, in terms of both means and ends, we worked with the University of Chicago Harris School of Public Policy and the Associated Press–NORC Center for Public Affairs Research to assess these views. We fielded surveys of a nationally representative sample of more than 2000 Americans, with two waves in February 2020 and May 2020 spanning the explosion of the Covid pandemic, though there are of course limits to the generalizability of any two snapshots. To elucidate some central trade-offs involved in redistribution and plan design, we focused on three aspects of preferences and priorities: how altruistic Americans are, the importance they place on various features of insurance plans, and their beliefs about government’s effectiveness in improving the health care system.
[..] As our results suggest, we all want different things from our health insurance plans — and our preferences vary in ways that don’t line up with our party affiliations. We asked participants which aspects of insurance plans were more important to them, focusing on the inherent trade-offs between costs and coverage (e.g., higher premiums for broader coverage versus lower premiums but restricted networks). There was no dominant view, with preferences almost evenly divided on multiple trade-offs.
[..] If we want to improve our health care system, we must confront the difficult trade-offs inherent in the allocation of limited resources for potentially lifesaving care. If we want to expand coverage to people who can’t afford it, we have to prioritize making the resources available to do so. And if we want to have more expansive plan features and more generous coverage, we have to be willing to pay higher premiums.
Expanding insurance coverage is a priority that many of us share, but a one-size-fits-all single-payer plan is unlikely to meet everyone’s needs. Americans vary in their level of concern about coverage, cost, and quality, but most are more concerned about those features for others than for themselves. People’s divergent preferences regarding features of their own insurance highlight the value of having varied options to choose from — and the challenge of designing one insurance plan that would satisfy everyone.
Views regarding the government’s role in improving the system are sharply divided along partisan lines, in keeping with evidence from many polls about political divisions in support for particular health policy provisions. Such divisions suggest that the prospects for large-scale reforms remain limited by the political landscape. A successful approach might be to extend insurance coverage protections while maintaining a range of insurance plan designs and private-sector incentives to drive innovation. This approach differs from those taken by many other countries (and touted in many reform proposals), but is in fact the core approach in Medicare Advantage, Medicare Part D, and the Affordable Care Act — and it seems to match Americans’ priorities.”
What Values and Priorities Mean for Health Reform Baicker K and Chandra A. NEJM 2020.9.16
“[Lee] If we had a drug that led to a 25% decrease in mortality for a common serious problem like stroke and a 6% decrease in cost, I think it’s safe to say that the manufacturer of that drug would be incredibly wealthy and there would be television ads everywhere. That is my understanding of what the London stroke initiative did, [though] not through drugs: They did it through the creation of social capital.
[Darzi] Although the technologies were there, you couldn’t have achieved or created the health value from a patient’s perspective without in actual fact doing a major change in the way we deliver service.
[..] There were 32 hospitals [..] delivering stroke services in London, serving a population of about 6.8 or 7 million people. If you went on a deep dive in each of these hospitals, with the exception of one, none of them were meeting the international gold standards in stroke care delivery. In each one of them, there was something missing in that pathway of care, whether it was referral, access by an ambulance, how long did the patient wait for the imaging, how quickly the intervention happened.
[..] Discourse between the clinicians and the patients and the public came to the conclusion that if you look at the population of London, we actually need no more than six comprehensive stroke centers, not 32, and we should come up with a strategy that will concentrate the provision of these services in these six comprehensive centers. The trick that I used at the time, I told them, “I don’t want to know which hospitals these six would be. Just give me an idea of how many comprehensive stroke centers we need, working with the patients in front of you and the public and the evidence, then we will sort out where they would be.” I took out completely the emotional attachment between these clinicians and the hospitals they were working in versus what London and its population need, and that’s the conclusion they came up with, based on the evidence.
[Lee] It’s such an amazing story that, in order to diffuse innovations, you had to concentrate the care. What everyone is impressed by is that you were able to persuade 26 out of those 32 hospitals to stop taking acute stroke patients.
[Darzi] The conclusion of the 100 people who were with us in this journey for a year, when they looked at the stroke data, [they] said, “So doc, are you telling me that I should tell the ambulance to go to a stroke center rather than the nearest hospital?” I said, “Yes, sir. That’s the answer to your question.” Patients and the public are fully engaged once we, as clinicians, share that evidence with them, and the empowered patient is probably one of the most powerful drivers for change.
[Lee] When I think about the beauty of the idea and the power of the idea, those seem clear when you’re sitting in a conference room, but out in the real world, hospitals that are realizing that the implication is that they can no longer take stroke patients, they find a way to resist it. I often teach the London stroke case at Harvard Business School, and the people in the audiences, in the classes, who are often health care leaders, they are impressed. [But] then when I ask could they do it in their cities, they always say no. It was logical what you did, but hard. How hard was it? What kind of resistance did you get, and how did you overcome it?
[Darzi] Looking at the evidence, working with the patients, that was the decision, and the evidence was there, there’s no question. Doing all the analytics, you came across [that] six centers is what you need. That was the first part of it. [..] The second part was difficult, and I wasn’t involved in that. It was Dame Ruth Carnall, who was the senior leader who commissioned services. She put out a call to say every hospital in London needs to bid for one of these comprehensive stroke centers. Based on the quality of what they put in, based on the population, based on the pathways of care, a decision was made how to pick these six hospitals that are currently providing stroke services. We did it in two phases, and that was very powerful.
The most powerful was empowering the patients. How many times have you asked a doctor you’re seeing, in front of you, “Tell me, which is the best hospital that does that?” They never tell you, “Go next door, get it done.” They always point out, “This is the best hospital we work in.” Getting that transparency with the public, with the patients — and the public are the taxpayers in our system; we do say [health care] is free at the point of need, but there’s nothing free in this world, the NHS [National Health Service] is funded by the taxpayer — so having both the public and the patients involved in this whole redesign was extremely powerful in changing clinical behaviors and also managerial behaviors, because managers are constantly believing that if you take the service out, it’s going to financially destabilize the hospital. That might seem true, but if you look at the facts, that is not true because doing small-volume, poor-quality service is terribly expensive.
[..] By the way, it’s not just stroke. It’s myocardial infarction, as well. If you’re going to have MI in a city, have it in London, because rest assured that whoever is going to pick you up, an ambulance, will know exactly where to take you and you know that exactly when you arrive through that door, you’re going to get the best treatment based on the greatest evidence and all the infrastructure and the expertise available. That’s a good deal.
[Lee] More patients receive thrombolytic therapy for stroke, but it was only 14% versus 9%, or something like that. It can’t account for a 25% decrease in mortality. What do you think led to the tremendous improvement, as well as the efficiency?
[Darzi] It’s more a concentration of expertise in each of these centers. We had less cost because we were [no longer] running 32 substandard providers. We calculated the cost [and] I think the whole of London was spending more money on stroke services than the whole of Sweden, and we were getting much poorer outcomes. So there were significant savings there.
[Lee] Thirteen years later, is there anything that you would have done differently if you could go back and do it again?
[Darzi] I don’t think I would have done anything differently in stroke services. The question I keep asking myself: Have we learned from the stroke services, for doing it in other pathways of care? There’s a lot to be learned from that. We need a process in which we constantly, when we evaluate a new technology or a new innovation or a new disruption, we need to look at not just the technology, [but also] we need to look at the whole redesign of the pathway if you want to create the maximum value out of that innovation.
[..] when a new disruption happens, it’s always a centralizing driver, as we have seen in stroke services. But let’s not forget, after 1 or 2 decades, technology could also be a decentralizing factor. Creating stroke networks is another thing which has matured in the last 5 years or so where the acute phase could be treated in the comprehensive stroke center, but the rehab could be done at the periphery. There’s a huge amount of excitement at the moment in using digital application, or what I call a device and an app, in stroke rehab, which a lot of people are looking into. Quality is a moving target. As long as you always remember that fact, then you should always keep up with what’s new, what’s coming out, and how do we change the whole pathway.”
Lessons from the London Stroke Initiative: How Pathway Improvement Is Discovered, Designed, and Deployed Lee TH interviewing Lord Darzi A. NEJM Catalyst, October 2020 issue
“People form new, health-protecting habits when they repeat behaviors that are rewarding, especially when gratification occurs in the short term, when they feel a sense of self-efficacy, and when they have information about the appropriate way to practice those behaviors. People also are more likely to adopt healthy habits when they encounter fewer barriers to the desired behavior change. There is not strong evidence that explaining the science of disease can directly change behavior, let alone habits. Thus, simply explaining the science of COVID-19 and its risks will rarely translate to a change in attitudes and behaviors even if people understand and accept the facts, and even if they would report that they should behave differently given the new information. The key reasons people do not do things they know they should are cognitive preferences for old habits, forgetfulness, small inconveniences in the moment, preferences for the path of least resistance, and motivated reasoning (i.e., the tendency of individuals to fit their processing of information to conclusions that suit some end or goal).
- Make the Behavior Easy to Start and Repeat
- Make the Behavior Rewarding to Repeat
- Tie the Behavior to an Existing Habit
- Alert People to Behaviors That Conflict with Existing Habits and Provide Alternative Behaviors
- Provide Specific Descriptions of Desired Behaviors
This rapid expert consultation also explores 10 risk communication strategies, again with supporting examples:
- Use Clear, Consistent, and Transparent Messaging
- Avoid Undue Attention to the Frequency of Socially Undesirable Behaviors
- Foster a Sense of Efficacy and Avoid Fatalism
- Appeal to the Collective Good of One’s Community
- Use Messengers Trusted by the Target Audience
- Tailor the Framing of the Message to the Audience
- Link Prevention Behaviors to People’s Identities
- Highlight Social Disapproval of a Target Audience Member’s Failure to Comply When It Occurs
- Highlight the Growing Prevalence of Behavior Change within the Target Audience When It Occurs
- Avoid Repeating Misinformation, Even to Debunk It
National Academies of Sciences, Engineering, and Medicine 2020. Encouraging Adoption of Protective Behaviors to Mitigate the Spread of COVID-19: Strategies for Behavior Change. Washington, DC: The National Academies Press. https://doi.org/10.17226/25881. (Brossard D, Wood W, Cialdini R and Groves RM. July 2020)
“informaticists, statisticians, and clinicians from the Observational Health Data Sciences and Informatics (OHDSI) international collaborative launched the Large-Scale Evidence Generation and Evaluation across a Network of Databases (LEGEND) research initiative. LEGEND generates evidence on the effects of medical interventions using observational health-care data, while addressing the aforementioned concerns of observational research by following a recently proposed paradigm for generating evidence. [..] A key element of this new paradigm is that evidence should be generated at scale. Rather than answering a single question at a time, many research questions are better addressed in a single study; for example, comparing all treatments for a disease for a wide range of outcomes of interest. This shift to large-scale analyses enhances the comprehensiveness of the evidence base, and disseminating all generated evidence without filtering prevents publication bias and P hacking. Furthermore, applying a systematic approach to answer these questions allows us to evaluate the performance of our evidence generation process.
- LEGEND will generate evidence at a large scale.
- Dissemination of the evidence will not depend on the estimated effects.
- LEGEND will generate evidence using a prespecified analysis design.
- LEGEND will generate evidence by consistently applying a systematic process across all research questions.
- LEGEND will generate evidence using best practices.
- LEGEND will include empirical evaluation through the use of control questions.
- LEGEND will generate evidence using open-source software that is freely available to all.
- LEGEND will not be used to evaluate new methods.
- LEGEND will generate evidence across a network of multiple databases.
- LEGEND will maintain data confidentiality; patient-level data will not be shared between sites in the network.
[..] the LEGEND framework creates artifacts to assess the internal validity of results, such as covariate balance to assess confounding control, coverage statistics after empirical calibration to assess systematic error, and heterogeneity assessments to assess database consistency. Our framework ensures that such an assessment using the GRADE (Grading of Recommendations Assessment, Development, and Evaluation) guidelines[17] is possible. GRADE assessments cover:
- The risk of bias, which we address using best-practice methods by evaluating study diagnostics, such as covariate balance, and by evaluating systematic error through the use of negative and positive controls.
- Imprecision, as expressed in our (calibrated) CIs. By including data from many databases, we typically achieve high precision.
- Inconsistency, which we address through the use of multiple databases and the inspection of between-database heterogeneity.
- Indirectness, through making all possible comparisons.
- Publication bias, through complete dissemination of study results irrespective of the effect estimates.
“Just” generating large amounts of evidence does not guarantee the translation of the evidence generated into better care at the bedside. Although any physician faced with a specific clinical question can directly consult the evidence in the LEGEND results database, the interpretation of that evidence, as discussed above, may prove non-trivial. To bridge the gap between evidence and clinical practice, we suspect an intermediate step must be taken. A form this step can take is papers focused on specific clinical implications, such as our recent paper comparing first-line hypertension treatments at the class level. It is anticipated that the evidence generated by LEGEND will eventually help to support changes to treatment guidelines, particularly in treatment comparisons for which evidence from randomized trials is unavailable.”
Principles of Large-scale Evidence Generation and Evaluation across a Network of Databases (LEGEND) Schuemie MJ, Ryan PB, Chen RJ et al. JAMIA 2020.9.10
“A focused review of existing guidelines and recommendations was completed to identify and prioritize potential deintensification indications. Then, 2 modified virtual Delphi expert panels examined the synthesized evidence, suggested ways that the candidate recommendations could be improved, and assessed the validity of the recommendations using the RAND/UCLA Appropriateness Method. Twenty-five physicians from Veterans Affairs and US academic institutions with knowledge in relevant clinical areas (eg, geriatrics, primary care, women’s health, cardiology, and endocrinology) served as panel members.
[..] To our knowledge, this is the first study to develop a reproducible method to identify, validate, and precisely specify indications for deintensification of medical services. Starting from a set of 86 guidelines, Choosing Wisely recommendations, and National Quality Forum measures, we identified 409 recommendations, corresponding to 178 unique indications, that represented opportunities to stop or scale back routine services in primary care. After prioritization, specification, and expert panel revisions, the expert panels rated 37 of 44 deintensification recommendations as valid and 32 as both valid and an important improvement opportunity. The initial prioritization of recommendations by the investigators and advisory council and the panelists’ opportunity to discuss and improve the deintensification specifications developed by study staff may have facilitated the panelists rating a high proportion of the recommendations as valid. Nonetheless, panelists recommended more precise specification of the population or action for almost every recommendation presented to them. The most common change to the population was to narrow the eligible individuals or expand the number of exclusions. The most common change to the action was to more specifically designate the time frame, allow for documentation to justify continuing the service or treatment, and more specifically identify the treatment (eg, types of medications). In almost all cases, this process resulted in narrowing what was considered as deintensification.
[..] while panelists approved the concept of deintensification, they, like most clinicians, were hesitant to broaden indications for providing fewer services and expressed concern about stopping services that might be indicated. This caution may be at least in part a result of the underdeveloped evidence base for deintensification, leading to clinical uncertainty about safety, the use of performance measures that focus predominantly on increasing treatments and tests, as well as a desire to preserve clinical autonomy and patient preferences. Thus, the recommendations from a process such as this may evolve as the evidence base grows and medical culture becomes more accepting that stopping or scaling back certain treatments and tests may translate to better care.”
Identifying Recommendations for Stopping or Scaling Back Unnecessary Routine Services in Primary Care Kerr EA, Klamerus ML, Markovitz AA et al. JAMA Internal Medicine 2020.9.14
2020.9.15
“When insured patients obtain prescription drugs at pharmacies, claims to insurers are typically processed in real time at the point of sale, much like a purchase using a credit card. The pharmacy receives confirmation regarding the patient’s insured status, that the drug is covered, whether any special requirements (such as prior authorization) apply, and how much the patient needs to pay out of pocket. These arrangements generally work well for patients, except when beneficiary cost sharing is based on undiscounted prices and rebates are substantial.
In Medicare Part D and many commercial health plans, rebates do not reduce the amount paid by an insured patient who uses the drug, flowing instead as an aggregate payment to the PBM, which in turn passes all or some of the amount on to the insurer. In a competitive market, these payments to issuers and PBMs will be passed on to consumers in some form. Specifically, rebates can be allocated to only lower premiums, to only reduce what patients pay, or to partially lower both premiums and cost sharing.
Consider four examples in which a manufacturer doubles the list price of a drug, from $500 to $1,000, but also newly negotiates a 50 percent—$500—rebate with a PBM. The PBM shares that rebate with the insurer, so the net price to the insurer before considering beneficiary cost sharing is unchanged at $500. In the first case, assume patient cost sharing is set at a certain number of dollars per prescription—such as a fixed $35 copayment—with no deductible; the change in list price from $500 to $1,000 would change neither what the patient pays ($35) nor the plan cost after accounting for both the new rebate and the beneficiary contribution ($465). Assume in the second case that the patient’s insurance has coinsurance (for example, 25 percent) based on increased list prices with no deductible, rather than a fixed copayment; the patient payment would double, from $125 to $250.
In a third case with a deductible of $1,000 or more (and no subsequent cost sharing), beneficiary cost would increase from $500 to $1,000. In a fourth case with the $435 deductible and 25 percent cost sharing that are standard in Part D, beneficiary out-of-pocket costs would increase by $125, from $451 to $576.
In all but the first case of a fixed copayment and no deductible, the cost to the insurer would fall significantly: by $125 in the second, 25 percent coinsurance case; by $500 in the third, high-deductible case; and $125 in the fourth, standard Medicare Part D case. Higher list prices increase what patients pay out of pocket and reduce plan spending by an offsetting amount, reducing premiums in Part D. Patients using expensive, highly rebated drugs pay significantly more, while healthy enrollees save money from the reduced premium. In addition, increasing list prices exposes beneficiaries to more risk and reduces the comprehensiveness of insurance coverage.
[..] Rising list prices lead to beneficiaries getting more quickly to the donut hole and then to catastrophic benefits, where Medicare pays 80 percent of drug spending. In fact, we find that 36 percent of non-LIS [Part D beneficiaries who do not receive low-income subsidies] beneficiaries who reached catastrophic coverage in 2017 would not have done so had cost sharing been based on net rather than list prices, which would have reduced federal reinsurance spending on the non-LIS beneficiaries by 19 percent. But the complex way in which federal spending on Part D is determined makes the net effect of rebates on federal Part D spending unclear and beyond the scope of this post.
However, the fact that Part D beneficiaries tend to prefer plans with low premiums creates a strong incentive for PBMs to favor drugs with large rebates, since those rebates enable Part D plans to reduce premiums. Thus, instead of creating incentives for plans and their PBMs to prefer drugs with the lowest net cost, the current system instead favors drugs with high rebates. In turn, this creates a system of incentives that can lead to higher drug spending overall.
[..] Even though beneficiaries might be better off from a combination of higher premiums, lower cost sharing, and more comprehensive insurance, this might be a hard sell due to the certainty of all enrollees paying modestly more in increased monthly premiums versus the uncertainty of some beneficiaries potentially paying significantly more in cost sharing for highly rebated drugs with high list prices.
[..] Current rules require Part D plans to reveal the point of sale or list prices of each of their drugs. This occurs because the Medicare statute splits the Part D benefit into four different segments, each of which has specified cost-sharing requirements. The first part of the benefit includes the amounts below the deductible. The second part starts at the deductible and ends at the “initial coverage limit.” The third part of the benefit (the donut hole) starts at the initial coverage limit and ends at the catastrophic threshold. The final part of the benefit includes all spending above the catastrophic threshold.
For standard, non-enhanced Part D plans, coinsurance must equal exactly 25 percent of a drug’s price above the initial coverage limit (part three above) and 5 percent of a drug’s price above the catastrophic threshold (part four above). This makes it easy to reverse engineer drug prices—simply by multiplying the 25 percent coinsurance by four (or the 5 percent coinsurance by 20). Thus, either banning rebates or sharing them with patients would reveal net prices, which could lessen competition and facilitate price collusion: A lack of price transparency benefits health plans and PBMs because manufacturers are more likely to offer lower prices or higher rebates if their competitors will not know about it, and thus will be unable to match such offers quickly. As noted earlier, the FTC has repeatedly taken the position that greater price transparency would increase—not decrease—actual drug costs.
[..] While sharing rebates with patients to lower their out-of-pocket costs would likely cause both commercial insurers and Part D plans to incur higher drug costs, commercial insurers have much more flexibility to avoid having such a policy visibly increase premiums than Part D plans do. This occurs because premiums for commercial insurance differ from Medicare Part D in important ways. Commercial insurance typically bundles drug benefits with overall health coverage, so premium cost associated with drug coverage is not separately identified. National Health Expenditures (NHE) data report drug costs account for 10.8 percent of commercial insurance expenditures; thus, if sharing rebates with patients resulted in an 8 percent increase in average cost associated with drug coverage that would translate to only a 0.9 percent increase in the overall cost of commercial insurance.
Additionally, commercial insurance typically has flexibility to modify the important elements of drug and non-drug benefits, the actuarial value of insurance versus cost sharing, and the allocation of premiums between employers and employees. As a result, modest changes in the cost of the drug benefit are unlikely to be visible to commercially insured enrollees—they would be rather small relative to overall cost of health insurance and could be easily offset by other modest changes in benefits or financing.
[..] Stand-alone Part D plans do not have this flexibility available to commercial insurers. The Medicare statute explicitly created a new, stand-alone outpatient prescription drug benefit with a separate beneficiary premium. [..] CMS annually makes public Part D plan premiums in a widely used website that facilitates comparing current and upcoming year new premiums, as well as comparing the premiums of different plans. As a result, even a modest increase in plan costs fueled by lowering beneficiary cost sharing will generate highly visible increases to Part D premiums.
[..] only a minority of Part D enrollees would be directly subject to the full brunt of these changes. Forty-four percent of Part D enrollment is in integrated Medicare Advantage plans with Part D benefits (MA-PD). [..] most Part D plans use supplemental benefit dollars to offset some or all of beneficiaries’ Part D premiums. As a result, while increases to Part D premiums would reduce funds available for plans to put toward other benefits, modest Part D premium increases would likely be absorbed more readily by these plans relative to stand-alone Part D plans.
Among the 56 percent of beneficiaries enrolled in stand-alone Part D plans, 47 percent of them (26 percent of all Part D enrollees) receive low-income subsidies, so premium increases would be borne primarily by the federal government rather than the beneficiary. Additionally, 18 percent of stand-alone Part D enrollees (10 percent of all Part D enrollees) are enrolled in employer-sponsored stand-alone Part D plans, where employers often subsidize premiums. Indeed, only 20 percent of all Part D enrollees are enrolled in stand-alone Part D without LIS or an employer sponsorship. Thus, potential premium increases associated with sharing rebates at the point of sale would only be absorbed directly by a minority of Part D beneficiaries, although they could result in increased other expenses.
[..] Sharing rebates with patients poses two substantially greater challenges in Medicare Part D than in commercial insurance: how to share rebates without undermining competition, and the political pushback from having monthly premiums increase. A third issue, sharing performance-based rebates at the point of sale, poses similar technical problems for commercial insurance and Part D but is solvable, as commercial insurers have already done, by basing payments on prospective estimates rather than actual amounts of rebates.”
Sharing Drug Rebates With Medicare Part D Patients: Why And How Lieberman SM, Ginsberg PB, Trish E. Health Affairs Blog 2020.9.14
“The 4Ms Framework is a set of evidence-based priorities designed to shift approaches to care for older adults by focusing on What Matters, Medication, Mentation, and Mobility. What Matters refers to the alignment of individuals’ specific health outcome goals and care preferences with their care plans. Medication refers to reductions in unnecessary medication use and specific attention to the use of medications that could interfere with patient care goals, mobility, or mentation. Mentation refers to the commitment to preventing, identifying, treating, and managing dementia, depression, and delirium. Mobility refers to the goal of ensuring that adults move safely and can maintain or improve function.
[..] Of the US hospitals, 41.5% had structured documentation of the 4Ms fully implemented across all units.
[..] While 83.1% of hospitals had an EHR field with caregiver information, 45.4% of hospitals had an EHR portal for long-term care facilities to access hospital information, 44.6% sent information electronically to long-term care facilities, and 32.1% had specialized training for adults/caregivers on the patient portal. All exchange/communication functions had been implemented in at least 1 unit in 16.2% of facilities, with these functions implemented across all units in 7.6% of hospitals.”
Hospital adoption of electronic health record functions to support age-friendly care: results from a national survey Adler-Milstein J, Raphael K, Bonner A, Fulmer T. Journal of the American Medical Informatics Association 2020.9.10
2020.9.14
“Diabetes affects 1 in 3 Medicare beneficiaries. Treatment guidelines recommend that most patients start treatment with metformin followed by second-line drugs until glycemic goals are reached. For years, these second-line drugs were predominantly inexpensive generic drugs, such as sulfonylureas and thiazolidinediones (TZDs). Recent guidelines, however, endorse costly, predominantly brand-name drugs, such as sodium-glucose cotransporter-2 inhibitors (SGLT2is) and glucagon-like peptide-1 receptor agonists (GLP-1RAs), as preferred second-line medications for patients with established or increased risk for atherosclerotic cardiovascular disease, heart failure, or chronic kidney disease. Some SGLT2is and GLP-1RAs offer cardiovascular benefits, and certain SGLT2is are protective against renal disease. A third novel class, dipeptidyl peptidase-4 inhibitors (DPP-4is), is also increasingly used after metformin.
[..] Across 3323 Part D plans nationwide, commonly covered GLP-1RAs, SGLT2is, and DPP-4is had monthly list prices between $434 and $935, compared with $3 to $11 for metformin, sulfonylureas, and TZDs. Projected copayments for novel drug regimens varied substantially by month, from $53 to $65 during the initial coverage phase to $116 to $186 during the coverage gap.
Total annual costs for common novel agents were $5202 to $11,225, compared with $31 to $136 for traditional drugs. Projected annual out-of-pocket costs for a novel drug regimen were $1231 to $1981, compared with $250 to $355 for traditional regimens.
[..] Under Medicare Part D in 2019, we found that list prices for novel diabetes drugs (SGLT2is, GLP-1RAs, and DPP-4is) approached 40 to 360 times the cost of commonly covered sulfonylureas or TZDs, and exceeded $5000 annually. Switching patients to these classes of drugs could increase their yearly out-of-pocket costs by 3-fold to 8-fold, from less than $360 to $1200 or up to $2000. For SGLT2is and GLP-1RAs, this increase of out-of-pocket costs could effectively divide Medicare beneficiaries with diabetes into 2 groups: those who can afford guideline-directed therapies with cardiovascular or kidney benefit and those obligated to use lower-priced alternatives for cost reasons.”
Out-of-Pocket Costs for Novel Guideline-Directed Diabetes Therapies Under Medicare Part D DeJong C, Masuda C Chen R et al. JAMA Internal Medicine 2020.9.14
2020.9.11
“By 2017, death rates due to drug poisonings had increased 3.6-fold and those due to suicide had increased 1.3-fold since 1999, while alcohol-induced deaths increased 1.4-fold during 1999 to 2017. Collectively, these 3 causes of death have been termed deaths of despair and have been largely discussed in relation to rising death rates among White men and women without a college degree.3 It is important to note that increases in death rates due to these causes have not been restricted to middle-aged White individuals in nonurban America. In fact, death rates from these causes increased from 2015 to 2016 across all racial/ethnic groups.
[..] We used US death certificate data for premature death (ie, ages 20-64 years) from drug poisonings, suicide, and alcohol-induced causes and conducted hot spot and trend analyses for each cause.
[..] During 2000 to 2017, 563 765 drug poisoning deaths (age-standardized rate: 17.6 deaths per 100 000 person-years [PYs]), 517 679 suicides (age-standardized rate: 15.8 deaths per 100 000 PYs) and 364 733 alcohol-induced deaths (age-standardized rate: 10.5 deaths per 100 000 PYs) occurred among individuals aged 20 to 64 years (1.8 billion PYs of follow-up) in the United States.
[..] The largest significant cluster of counties with elevated drug poisoning death rates extended from the Northeast into Ohio, Indiana, Kentucky, Tennessee, West Virginia, and parts of Virginia and North Carolina. Additional significant hot spots were identified in New Mexico, Colorado, Utah, and Oklahoma. In contrast, the significant hot spots in suicide and alcohol-induced death rates were largely confined to the western half of the US, with hot spots for both causes of death from Montana and North Dakota to New Mexico and Arizona. Hot spots for of all 3 causes were present in New Mexico and Colorado.
[..] Drug poisoning death rates increased 11.4% (95% CI, 8.7%-14.2%) per year during 2000 to 2006, 2.5% (95% CI, 0.6%-4.5%) per year during 2006 to 2013, and sharply accelerated to 15.0% (95% CI, 11.8%-18.3%) per year during 2013 to 2017. In contrast, alcohol-induced death rates started increasing during 2005 to 2012 (APC, 2.1% [95% CI, 1.5%-2.8%] per year) and accelerated to 4.1% (95% CI, 3.3%-4.9%) per year during 2012 to 2017. Suicide rates increased steadily at 1.8% (95% CI, 1.7%-1.9%) per. These increases indicate an additional 451,596 deaths, including 317,848 drug poisoning deaths, 85,769 suicide deaths, and 47,978 alcohol-induced deaths, during 2001 to 2017 more than what would have occurred if the death rates in 2000 had persisted.
[..] This cross-sectional study found that drug poisoning, suicide, and alcohol-induced death rates each increased dramatically among individuals aged 20 to 64 years in the US during 2000 to 2017. However, the demographic groups and geographic areas with the highest death rates and strongest increases over time differed by cause of death. Thus, these 3 causes of death should be considered separately when targeting public health interventions toward populations at the highest risk. Furthermore, it is important to reiterate that these increases are not limited to middle-aged White men and women, as they have impacted all racial/ethnic groups in recent years, nearly every US state, and rural and urban communities.
[..] While it is likely that increasing economic opportunities and wages and reducing inequalities would result in health improvements, prior work has shown that economic policies have not had a universal impact on rates of drug poisoning, suicide, and alcohol-induced deaths. For example, higher minimum wages and the earned income tax credit have been shown to reduce suicides but not drug poisoning deaths among adults with lower educational attainment. Another study by Ruhm found that economic factors are likely to explain only a small fraction of drug poisoning deaths, concluding that the availability and use of drugs is more likely to be the key driver. Ruhm found no association of economic factors with suicide and alcohol-induced death rates. Drug and alcohol poisoning and chronic liver disease death rates increased most rapidly in the most economically insecure counties, while suicide rates increased uniformly regardless of county-level economic insecurity.
Many deaths due to drug poisoning, suicide, and alcohol-induced causes may be broadly associated with underlying feelings of despair, whether driven by lack of economic opportunity or other factors. However, each cause of death also reflects access to drugs, alcohol, firearms, and other means of suicide. Although some policies aimed at prevention can be applied universally, population- and epidemic-specific targeted interventions are likely also needed. For drug poisonings, guidelines for safer opioid prescribing and use of medication-assisted treatment for substance use disorder, expansion of health care insurance coverage to include substance use disorder treatment, criminal justice reform, and expanded access to naloxone are policies that could help address the epidemic. Efforts focused on stopping drug trafficking are also critical. In 2017, the Centers for Disease Control and Prevention released recommendations for suicide prevention, including strengthening economic supports, increasing access to and delivery of preventive suicide care, creating protective environments, promoting connectedness, teaching coping and problem-solving skills, and identifying and supporting people at risk. People who have previously attempted suicide and those with severe depression are high-risk populations to target for suicide prevention interventions. Policies focused on reducing firearm access during periods of high suicide risk have also been recommended. Finally, the US Preventive Services Task Force recommends that primary care clinicians screen adults for unhealthy alcohol use and provide behavioral counseling interventions to those who engage in hazardous drinking.39 As American Indian and Alaska Native populations have the highest rates for all 3 causes, there may be alternative explanatory factors associated with the historical trauma in these communities, and interventions to address these disparities are needed.”
“a 2017 analysis from the Department of Health and Human Services estimated that up to 133 million people—51 percent of all Americans—had a condition that could make them uninsurable.
[..] The ACA addressed these gaps by improving the availability, affordability, and adequacy of private health insurance. Beginning in 2014, the ACA banned insurers from denying coverage or benefits or charging higher premiums because of a patient’s preexisting condition or health status. The law also capped annual out-of-pocket expenses for covered services, required plans to cover a package of 10 essential health benefits, and banned lifetime and annual dollar limits on covered benefits.
[..] Covering preexisting conditions is a challenge that is unique to the private health insurance system. The question of whether preexisting conditions are covered is not an issue in public coverage programs, such as Medicaid or Medicare. (Medigap policies, private supplemental coverage for Medicare enrollees, can impose limited exclusions for preexisting conditions.) Said another way, public coverage programs are designed to cover people with preexisting conditions (such as older Americans or people with disabilities), and Medicare and Medicaid eligibility has been expanded over time to cover those with specific conditions (such as end-stage renal disease or breast cancer).
[..] Without a level playing field, insurers will use the tools at their disposal to attract healthy people and limit enrollment of less healthy people in order to avoid adverse selection. When the same rules apply to all insurers, they are forced to compete on price and quality (rather than benefit design and cherry-picking healthy consumers). And prior state experience suggests that reforms alone are insufficient: there must be some mechanism, such as premium subsidies, to encourage healthy people to enroll and avoid either very high premiums or a death spiral.
[..] Guaranteed issue protections require insurers to issue a health plan to any applicant regardless of their health status or other factors. Guaranteed issue was adopted in the small group market under the Health Insurance Portability and Accountability Act of 1996 (HIPAA) and then extended to the individual market under the ACA. (HIPAA also included protections for some people in need of individual market coverage, but these protections were limited to those who were losing job-based coverage and maintained “continuous coverage.”)
[..] Even if a consumer could secure an individual market policy prior to the ACA, most states had no restrictions on what insurers could charge in monthly premiums. Thus, insurers were able to charge higher rates based on health status or medical history, demographic information (such as age and gender), and a person’s occupation, among other factors.
[..] The ACA banned these practices and ushered in community rating where rates in the individual and small group markets can vary based solely on four factors: family size, geographic location, age, and tobacco use. Although rates can vary for age and tobacco use, variation is capped.
[..] under the ACA which, beginning in 2014, banned insurers from using preexisting condition exclusions, required individual and small group plans to cover a package of at least 10 essential health benefits, banned lifetime and annual dollar limits on covered health care benefits, and capped annual out-of-pocket expenses for covered health care services. Without these comprehensive benefit standards and protections, individuals with preexisting conditions faced daunting barriers to obtaining coverage that was affordable and that would cover care they need.”
What It Means To Cover Preexisting Conditions, Keith K. Health Affairs Blog 2020.9.11
2020.9.9
“We created a cross-sectional sample of acute care hospitals that attested to participation in the MU [Meaningful Use] program and also participated in the Hospital Value-Based Purchasing Program (HVBP) from January 1 to December 31, 2016, then constructed quantile regression models to examine associations between MU performance measures and 14 outcomes of the HVBP covering patient satisfaction, spending, and safety domains. Although the data represent 2016, this analysis was performed from August 1, 2019, to May 22, 2020.
[..] The HVBP is a Centers for Medicare & Medicaid (CMS) program that awards or penalizes acute care hospitals for safety and quality outcomes using payment adjustments, and data are publicly available through the Hospital Compare website. Hospitals receive domain scores, each composed of 1 to several components, some of which have changed over time.
[..] The engagement domain reflects patient satisfaction and is derived from the Hospital Consumer Assessment of Healthcare Providers and Systems survey, which is sent to a subset of inpatients after hospital discharge to assess dimensions of satisfaction, including ratings of communication with nurses, communication with physicians, responsiveness of hospital staff, care transition, communication about medicines, cleanliness and quietness, discharge information, and the hospital overall. [..] Higher scores indicate better satisfaction.
The efficiency domain consists of a single measure, Medicare spending per beneficiary, which is reported as a ratio between the hospital’s mean price-standardized risk-adjusted spending per care episode divided by the national median of spending per episode. Lower scores indicate better efficiency.
The safety domain consists of several measures of in-hospital infections, accidents, and injuries. Among the components, the health care–associated infection measures are amenable to modeling. These reflect risk-adjusted standardized infection ratios for central line–associated bloodstream infections, catheter-associated urinary tract infections, surgical site infections (SSIs) after colon surgery, SSIs after abdominal hysterectomy, methicillin-resistant Staphylococcus aureus bacteremia, and Clostridioides difficile infection. These data are reported as ratios between observed and estimated infection rates. Lower scores indicate better safety.
The clinical care domain reflects 30-day all-cause mortality for 3 admission diagnoses. Although this domain is an important measure of hospital quality and safety, data for this domain have not been released for 2016, and thus we were unable to include it.
[Results] Patients accessing their information online was not significantly associated with any outcome.
[Discussion] Our finding of no association between patients accessing their information online and cost savings is consistent with past research.
[..] our results suggest that the MU performance measures used thus far do not straightforwardly estimate HVBP measures of patient satisfaction, efficiency, or safety. Although stage 2 of MU is largely in the past, stage 3 is the present for hospitals, and many of the performance measures for stage 3 are the same as those considered herein. Our results suggest that the current criteria may not be focusing on the right metrics to improve patient satisfaction, efficiency, and some measures of safety as measured by HVBP at all hospitals.”
Association of Electronic Health Record Use Above Meaningful Use Thresholds With Hospital Quality and Safety Outcomes, Murphy ZR, Wang J and Boland MV. JAMA Network Open 2020.9.9
“Special Needs Plans are specialized Medicare Advantage (MA) plans that target specific subgroups of high-need Medicare beneficiaries. These plans receive risk-adjusted capitated payments and are responsible for providing services that would otherwise be covered under fee-for-service Medicare. In addition, they are required to develop and describe specific models of care for eligible beneficiaries, including care coordination, population health management, and network and formulary design. ESRD SNPs tailor benefits and limit enrollment to beneficiaries with ESRD. Any Medicare beneficiary with ESRD may elect to enroll in an ESRD SNP if one is available in their county of residence.
[..] We studied ESRD Special Needs Plans offered by CareMore Health between 2010 and 2013. CareMore’s model of care has been previously described and includes enhanced care coordination and disease management, outpatient care centers, and physicians who see patients across the care continuum. CareMore began operating ESRD SNPs in 2007, and during the study period it offered these plans in Los Angeles, Orange, and San Bernardino Counties in California.
[..] At this time, there is no source that integrates data for both fee-for-service and MA beneficiaries, and data for the latter are not widely available. To address these challenges, we used two data sources: the United States Renal Data System (USRDS) and CareMore’s enterprise data warehouse. USRDS is a national data system that collects granular demographic, clinical, laboratory, and claims data on people with ESRD. We obtained USRDS data for 2010–17, which were the most recently available years at the time data were requested. USRDS contains claims data for fee-for-service Medicare beneficiaries only. To create a data set with complete claims information, we linked USRDS data to claims data from the CareMore enterprise data warehouse at the beneficiary level. This source contains paid claims for all beneficiaries enrolled in CareMore health plans, including ESRD SNPs.
[..] We used coarsened exact matching to match SNP enrollees with fee-for-service controls, using detailed data from USRDS. We chose coarsened exact matching because it allowed us to prioritize the match quality for a select number of variables. [..] Briefly, we matched beneficiaries on the following variables: age, sex, race, dual eligibility, area-level poverty, area-level population density, primary cause of ESRD, duration of ESRD, dialysis modality, and Charlson Comorbidity Index. All variables used for matching were assessed over the six months before exposure, a period when all beneficiaries were enrolled in fee-for-service Medicare. This eliminated potential bias from differential coding practices for Medicare Advantage and fee-for-service Medicare beneficiaries and allowed us to match on a common set of clinical and claims data. We did not match on preexposure outcomes to avoid introducing bias. Our implementation of coarsened exact matching matched one or more SNP enrollees to one or more fee-for-service controls and returned a weight for each beneficiary that was used in outcome models. We assessed covariate balance in the matched groups, using weighted standardized mean differences. We considered standardized mean differences less than 0.25 to be acceptable for covariates included in the final adjusted models.
[..] Coarsened exact matching retained 441 SNP enrollees, who were matched to 8,519 fee-for-service controls.
[..] Survival was significantly higher for SNP enrollees compared with fee-for-service controls (log rank p<0.001). The adjusted average hazard ratio for SNP enrollees (as compared with fee-for-service controls) was 0.51 (p<0.001).
[..] Compared with fee-for-service controls, SNP enrollees had lower adjusted rates of inpatient days (4.61 versus 12.5; p<0.001), inpatient admissions (1.01 versus 1.65; p<0.001), skilled nursing facility days (1.88 versus 7.39; p<0.001), skilled nursing facility admissions (0.22 versus 0.36; p = 0.016), and home health days (3.01 versus 8.71; p<0.001). Compared with fee-for-service controls, there was a trend toward more dialysis days (154.97 versus 139.81; p = 0.131) and fewer inpatient admissions for ESRD complications (0.36 versus 0.51; p = 0.172) for SNP enrollees. There was no significant difference in inpatient admissions for vascular access complications (p = 0.785) or all-cause thirty-day readmissions (p = 0.673).
[..] The magnitude of the association between SNP enrollment and reductions in mortality and utilization observed in this study exceeds those seen in evaluations of the ESRD Disease Management Demonstration6 and the Comprehensive ESRD Care Model. This suggests that SNPs may be a uniquely effective payment and delivery model. Of note, the population enrolled in the ESRD Disease Management Demonstration closely mirrored this study population with respect to clinical and demographic characteristics.6 The characteristics of patients in the Comprehensive ESRD Care Model were broadly similar, but with fewer Hispanic and more dually eligible patients.
[..] Considering the comparative effectiveness of nontraditional models is especially important in light of continued experimentation by CMS with the delivery and financing of ESRD care. Recently, CMS announced the Kidney Care First and Comprehensive Kidney Care Contracting models, which will replace the Comprehensive ESRD Care Model as opportunities for dialysis facilities, nephrologists, and other providers to assume financial risk for the care of patients with ESRD. As part of the 21st Century Cures Act, patients with ESRD will be able to enroll in traditional MA plans starting in 2021. As these new models of care for patients with ESRD expand, it will be important for CMS to closely monitor their impact on quality, cost, and other outcomes and to expand access only to the most effective models. SNPs, which integrate financial risk and specialized models of disease management and care coordination, may be more effective than models narrowly focused on alternative financing.”
The Beneficial Effects Of Medicare Advantage Special Needs Plans For Patients With End-Stage Renal Disease, Powers BW, Yan J, Zhu J et al. Health Affairs 2020.9.8
“We sought to apportion mortality changes for each cause of death associated with an increase or decrease in life expectancy of 0.1 years or more into the change attributable to public health, pharmaceuticals, and other medical care.
[..] This approach had limitations. First, the attribution of responsibility for improved survival to public health, pharmaceuticals, and other medical care was constrained by the availability of literature and the need to impose subjective distinctions. It was also limited in that current knowledge may change over time. Second, the use of cause deletion required assuming that competing causes of death are independent from one another. This implies that the impact from any given cause may be misstated if the cause is strongly correlated with other causes. Third, life expectancy trends vary over time by race, ethnicity, education, geography, and other key dimensions, whereas this analysis is limited to overall trends. Fourth, coding changes over time, including the switch from ICD-9 to ICD-10, could affect findings. Fifth, we examined life expectancy at birth. Results could differ with related metrics, such as average populationwide mortality rates. Sixth, morbidity changes may be equally important but were not included in our primary analysis. Seventh, the time period of the study predated the coronavirus disease 2019 (COVID-19) pandemic.
[..] Ischemic heart disease (1.76 years), lung cancer (0.34 years), and stroke (0.33 years) accounted for the greatest shares of improvement. Accidental poisoning or overdose (−0.32 years), dementia excluding Alzheimer disease (−0.19 years), and Alzheimer disease (−0.14 years) accounted for the greatest decrements in life expectancy.
[..] Diseases of the circulatory system, cancers, and trauma (excluding suicide) accounted for 62 percent, 18 percent, and 9 percent of life expectancy improvement, respectively.
[Ischemic Heart Disease] The IMPACT model [a validated statistical model used in more than 20 countries to explain changes in death from heart disease over time] estimated that 52 percent of the decrease in mortality was attributable to pharmaceuticals and 7 percent was attributable to other medical care.
[..] The most important pharmaceutical treatments were care for hypertension and high cholesterol and, to a lesser extent, medications for secondary prevention after myocardial infarction and angina. With respect to other (nonpharmaceutical) medical care, rehabilitation and revascularization were of approximately comparable importance. Another 39 percent of mortality decline was attributed to improved public health not resulting from medications, principally reduced cholesterol and blood pressure. Although smoking decreased, benefits were partially offset by increases in body mass index and diabetes; we characterized these changes as public health. Approximately 2 percent of mortality improvement was not explained by the IMPACT model.
[Cerebrovascular Disease] Sixty percent of reduced mortality was attributable to pharmaceuticals (including antihypertensives, statins, and anticoagulants), and 8 percent of reduced mortality was attributable to other medical care (carotid endarterectomies and rehabilitation). The remaining 32 percent of mortality reduction was attributed to unmodeled public health improvements, such as reduced smoking and hypertension not achieved through medical treatment.
[Lung, Bronchus and Trachea Cancer] Age-adjusted lung or bronchus cancer incidence fell 25 percent between 1990 and 2015, whereas mortality decreased 31 percent. Thus, decreasing incidence accounted for 81 percent of the decrease in mortality. Because smoking is the primary risk factor for lung cancer, we attributed 81 percent of reduced mortality to public health.
[..] Meta-analyses suggest a reduction in mortality risk of 13 percent in association with chemotherapy for treatment of non-small-cell lung cancer (roughly 80–90 percent of lung cancers).The share of patients with lung, bronchus, and trachea cancer receiving chemotherapy increased from 28 percent of known patients in 1990 to 40 percent in 2015. Even without accounting for advances in therapeutic effectiveness, increasing chemotherapy use accounted for 5 percent of reduced mortality. We attributed the residual mortality improvement (11 percent) to other nonpharmaceutical medical advances, such as improvements in surgery and radiotherapy.
[Breast Cancer] Averaging across models, 60 percent of improvement was attributable to medications, 31 percent of improvement was attributable to screenings, and 9 percent of improvement was unexplained.
[Colorectal Cancer] 27 percent of improved survival was attributable to pharmaceuticals (chemotherapy), 42 percent was attributable to medical care (cancer screening), and 31 percent was attributable to public health (especially decreased smoking).
[Motor Vehicle Accidents] The alignment of results across models provided additional support for attributing 10 percent of reduced motor vehicle accident fatalities to other medical care and 90 percent to public health.
[Infant Mortality] Aggregating, we estimated that 39 percent of reduced infant mortality was attributable to public health, 21 percent to pharmaceuticals, and 20 percent to other medical care.
[HIV] Surveyed physicians estimated that pharmaceuticals accounted for 76 percent of reduced HIV morbidity and mortality between 1990 and 2015. Nonpharmaceutical medical technologies, such as diagnostic testing, accounted for nearly all the remainder. Responding physicians reported that other factors, including public health, accounted for only 0.3 percent of improvement.
[..] Male-to-male sexual contact is the most common mechanism of HIV transmission in the US. Risky sexual practices among men who have sex with men increased between 1992 and 2013.18 Therefore, although transmissions might have increased faster but for public health efforts, it is unlikely that public health efforts contributed to improvements between 1990 and 2015.
[Discussion] We studied contributors to life expectancy changes for twelve conditions accounting for 2.9 years of improved life expectancy in the US between 1990 and 2015. We found great variation in the key drivers of mortality change across causes. In our primary analysis, 44 percent of improvement was attributable to public health, 13 percent was attributable to nonpharmaceutical medical care, and 35 percent was attributable to pharmaceuticals. The share of survival deterioration attributed to pharmaceuticals (−9 percent) was outweighed by the share of improvement attributed to pharmaceuticals (44 percent).
[..] Our findings have implications for the ongoing debate regarding the value of health care spending in general, and spending on pharmaceuticals specifically. Although our findings do not speak directly to the value of treating additional people with medications, they do underscore the central role of medications overall in explaining reduced mortality. Policy making on drug pricing should consider the implications of potential legislation across the full spectrum of conditions—both those where the societal return on drug investments is high and those where expected value is more ambiguous.
Our results also suggest the importance of minimizing cost-related barriers to key preventive and chronic care services. For example, coverage expansions through the Affordable Care Act have been associated with increases in early-stage cancer diagnoses as well as increased use of heart disease medication. For the insured, elimination of cost sharing for primary prevention may have led to increases in cancer screenings. Given substantial underuse of high-value care, longevity gains might have been larger if coverage gains had been more complete and if out-of-pocket spending for secondary preventive services had also been reduced. Expanding coverage and advancing value-based insurance design therefore remain important needs.”
Contributions Of Public Health, Pharmaceuticals, And Other Medical Care To US Life Expectancy Changes, 1990-2015, Buxbaum JD, Chernew ME, Fendrick M and Cutler DM. Health Affairs 2020.9.8
“Over 90 percent of the prescriptions filled in the US are for generic products, and, when available, generic drugs offer patients access to the same active ingredient as brand-name drugs, at greatly reduced costs.
[..] I have learned that today’s pharmaceutical market is not always an advocate for ensuring access to safe and effective generic medications for my children and my patients. Physicians are in an impossible situation of having to grapple with the quality of generic medications for patients in a system that is difficult to understand and entirely out of their control.
This is not a “bash the FDA” assessment; it is more of a realization that we have relied on the FDA as a resource well beyond what anyone would envision as the role of a single federal agency dealing with a complex market and a global supply chain. The FDA recently supported this assessment in 2020 testimony before Congress, stating: “Many pharmaceutical manufacturers, whether domestic or foreign, have been slow to invest in these mature quality management systems because the market currently has no visibility into manufacturing facilities’ quality. This lack of transparency reinforces competition based solely on price and disincentivizes companies from making investments in upgrading their facilities and quality practices until problems become frequent and severe enough to result in supply disruptions and drug shortages.”
The issue here is one of accountability: The public has become acutely aware of the fragility of the health care supply chain as a result of the COVID-19 pandemic, including but well beyond the issues of generic medications. I can’t imagine another industry suggesting they got a good price on a critical outsourced supply, while ignoring the issues of quality and availability. [..] The private actors in the market—distributors, retail pharmacy chains, and possibly even payers—need to assume a greater role in ensuring drug quality, possibly including implementing their own testing programs. For example, Civica Rx (for which I am an advisory board member) is a nonprofit generic drug maker funded by health systems and philanthropies to ensure the quality and availability of medications for the inpatient setting.
[..] When I fill a prescription, I want to know that the pharmacy holds itself accountable not just to dispensing a quantity of a given chemical entity but to the success of the resulting medical management that was the purpose of the prescription in the first place. The generic drug market is too valuable to the public to allow quality lapses to force us back to branded medications after drug patents expire.”
Challenges In Ensuring The Quality Of Generic Medicines, Schulman KA. Health Affairs 2020.9.8
“Nearly a quarter of healthcare consumers (23%) say reliable and secure digital tools that help them to understand their health habits would motivate them to take a more active role in managing their health. More than half of consumers (55%) said “trusted healthcare professionals” would motivate them to take a more active role in managing their health, yet only 11% said that their healthcare providers recommended use of digital tools for patient health management.
[..] Half of healthcare consumers surveyed agree that a bad digital experience with a healthcare provider ruins the entire experience with that provider—and 39% believe a good digital interaction has a major influence on the patient experience. More than a quarter (26%) are even willing to switch to a new provider for high-quality digital services. 52% of consumers who have a primary care physician agreed that a bad digital experience with a provider ruins the entire experience with the provider, compared to 42% of those without a PCP.
[..] In 2019, 89% of healthcare consumers trusted their doctor or other provider “very much” or “some” to keep their digital healthcare information, such as electronic medical records, secure. That percentage dropped to 83% in 2020. Trust in tech companies has also declined. More than half of consumers (55%) do not trust these companies to keep digital health information secure. When asked “how much do you trust each of the following organizations or people to keep your digital healthcare information secure?” doctors ranked as second-most trusted (83%)—following hospitals (84%)—whereas tech companies ranked second to last (45%) [government came in last at 38%, but health insurance companies were at 75%].
[..] many healthcare consumers would choose virtual for basic care services, and even for specialty care. They “definitely” or “probably” would receive health and wellness advisories (62%) and remote monitoring of ongoing health issues through at-home devices (57%).
[..] While higher numbers of healthcare consumers are open to receiving virtual healthcare services from their traditional providers (54%), they are also willing to receive virtual care from technology or social media companies such as Google and Microsoft (27%); retail brands such as Best Buy, Walmart and Amazon (25%); and medical startups (21%).”
How can leaders make recent digital health gains last? Re-Examining the Accenture 2020 Digital Health Consumer Survey US Findings Safavi K and Kalis B. Accenture, August 2020.
“There are several policy solutions to limit manufacturers’ ability to delay generic competition by introducing new versions of existing products. First, manufacturers could be required to notify the Federal Trade Commission when they receive additional patents that could extend exclusivity on their products, allowing an opportunity to track potential anticompetitive practices. Second, the US Congress could limit pharmaceutical protections to a single regulatory exclusivity period per drug (eg, 1 patent per drug). If implemented, such a policy would likely need to be complemented by a strategy to encourage incremental innovations on existing products, although the rewards offered could be capped or more directly tied to the value they provide to patients.
Third, states could adopt broader therapeutic interchange laws to allow direct competition among different formulations of the same active ingredient. Currently, pharmacists may substitute only exact generic copies of a drug, and allowing pharmacies more flexibility to fill prescriptions with cheaper, therapeutically equivalent alternatives could have saved patients and payers $100 billion from 2010 to 2012. Fourth, increased price transparency or eliminating confidential manufacturer rebates could simplify the marketplace and allow more direct competition between brand-name and generic products. In the case of glatiramer, the first generic product was priced higher than the net price for brand-name drug after confidential rebates. This higher pricing may have contributed to the slow initial generic uptake from 2015 to 2017, and generic competition might have been more effective if net prices for the brand-name drug had been available to the generic drug maker.”
US Spending Associated With Transition From Daily to 3-Times-Weekly Glatiramer Acetate, Rome BN, Tessema FA, Kesselheim AS. JAMA Internal Medicine 2020.7.20
2020.9.7
“Patient matching provides the opportunity to improve patient care and clinical research by identifying and potentially controlling for key covariates that may help predict a patient’s outcome.
[..] While the science of patient matching has vastly improved, our ability to communicate about the type of patient similarity we use has become a significant challenge. Advances in multi-dimensional patient matching have been slow to develop due in part to the heterogeneous interpretations that exist within similarity matching. A continued lack of consensus regarding terminology, methods, and data types has resulted in poor consistency of resultant findings of patient-matching studies. While the science of patient matching has vastly improved, our ability to communicate about the type of patient similarity we endeavor to accomplish has become a significant challenge.
[..] Patient similarity can be divided into 4 classes: 1) feature; 2) outcome; 3) exposure; and 4) mixed-class.
- Feature similarity – the state of a physical object or short period of a “snapshot” (e.g., using diagnostic billing codes to define groups of patients). [..] developing high-dimensional feature similarity quickly results in inaccurate or minimal similarities between patients, particularly when dimensionality exceeds the number of patients in a study.
- Outcome similarity – matches in temporal-based endpoints. [..] Outcome similarity metrics may ultimately be used to develop quintessential real-world evidence (RWE). As RWE is not without its limitations, developing granular understanding of its contribution to data from existing clinical trials can help [..] reduce uncertainty for patients and practitioners surrounding treatment decisions. Pulling these outcome measures from systematically mapped sources of structured data reduces variability and enhances RWE as a modeling tool. Data in this space are inherently challenging to analyze and are highly subject to selection bias and confounding.
- Exposure similarity – based on the presence or absence of therapeutic interventions or other exposures which affect their health status. [..] exposure similarity defines changes over time, adding a temporal dimension to patient similarity.
- Mixed-class similarity – the interaction of these classes. [..] In modern clinical medicine, attempting to derive general phenotypes for patient matching may be extremely challenging; in effect, suffering from a “curse of dimensionality” would imply no 2 patients are similar in any meaningful way given the near infinite data necessary to accurately portray a patient. Mixed-class similarity represents a challenge computationally that has yet to be well-addressed. It is likely that computable similarity efforts that are task- and setting-dependent will improve its applicability.
[..] In many respects, it is easier to sequence a whole cancer genome in 2020 than to readily and reproducibly define a group of “similar” patients. Similarity classes create a framework for defining groups of patients who are likely to have similar defining traits, outcomes, and/or temporal experiences. This aids clinicians in their treatment decisions and patients in anchoring themselves to a defined wellness or illness group. While every patient is unique and every journey is different, practically, treatments are targeted toward a group of patients with similar characteristics for whom we reasonably would expect a similar response. This is the same reason nomenclature has moved from personalized medicine to precision medicine.”
Recommendations for patient similarity classes: results of the AMIA 2019 workshop on defining patient similarity, Seligson ND, Warner JL, Dalton WS et al. JAMIA 2020.9.4
2020.9.6
“as those of us who work in social justice health care are fond of saying, if you can make a difference in the highest-risk populations, chances are you will help all populations, whereas medical history has clearly demonstrated that the reverse is not true.
[..] Compared to peer nations, the United States has the highest rates of chronic disease, the greatest number of preventable hospitalizations, the lowest life expectancy, and the highest rates of suicide, obesity, and avoidable deaths. These outcomes are produced by a system that costs nearly twice what near peer countries spend and occurs as a result of bureaucratic inefficiencies, overuse of expensive technologies and procedures, and relative underuse of primary care, physician visits, and other cognitive, interpersonal resources.
[..] What might a new, better US health care system look like? It seems clear that it will include significant amounts of telehealth, but change can’t stop there. The new system must also prioritize and pay for the prevention and care of disorders and populations commensurate with their prevalence and risk. To accomplish this, it will need to become a truly evidence-based health care system, not one that cherry-picks the evidence to support preexisting biases.
[..] When the United States pivoted to telehealth in March 2020, lower income, rural, elderly, and disabled populations—those groups most likely to live across the digital divide—were placed in acute-on-chronic jeopardy. Already disadvantaged, they were precipitously told that access to medical care required a digital device, internet connectivity, and digital literacy. This meant many would simply not get health care and, worse, would miss the health encounter that is for some older and disabled adults the primary social activity of their week or month.
Paradoxically, these same groups stand to gain considerably from telehealth if its effectiveness is mostly equivalent to in-person care as Choi et al and others have found. Telehealth visits are less physically and fiscally costly for frail, disabled, and lower-income patients; they allow those with limited energy to save their reserves for more important activities that may enrich their lives and improve their health. At the same time, the digital divide may be one reason for the social isolation of some older and disabled adults for whom digital devices and capability would provide new access to essential services, social and occupational opportunities, and health promotion activities. Among the notable findings of the study by Choi et al unrelated to mental health measures were that many participants preferred the ease and privacy of telehealth. They further found that the costs of a video platform and Wi-Fi connection were significantly less than the costs of sending practitioners on house calls. Thus, for some older patients with multimorbidity and considerable health and social burdens, telehealth is not only possible and cost-effective, it is desirable.
[..] Critically, the US health care system must raze and rebuild its foundational assumptions and structural priorities. It must fund and disseminate interventions that work regardless of who does them (lay counselors vs professionals; social workers, pharmacists, physical therapists, nurses, and all other health professionals vs physicians), how they work (using verbal and relational tools vs technical and pharmacological ones), and who needs them (people who are poor, old, young, disabled, female, black, brown, or gay vs middle- to upper-class, adult to middle-aged, able-bodied, white, heterosexual, Christian or Jewish males). It also needs to respect social proxies and evidence as it already does physical ones; just as we know lowering cholesterol lowers the risk for vascular diseases, so too do we know that improving mood and opportunities improves physical and social function. As Choi et al point out, medications only target disease whereas nonpharmacologic treatments, including the ministrations of trained lay people or professionals, can treat disease and also address the social and behavioral contributors to poor health outcomes and high health care costs.”
Evidence, Efficacy, and Economics—A Better Path Forward for US Health Care, Aronson L. JAMA Network Open 2020.8.31
2020.9.4
“Non-communicable diseases (NCDs) are the leading cause of death and ill health and account for seven of ten deaths worldwide. NCDs are included in the Sustainable Development Goals (SDGs) with the following target: “by 2030 reduce by one third [relative to 2015 levels] premature mortality from NCDs through prevention and treatment and promote mental health and well-being” (SDG target 3.4).
[..] The indicator used to measure progress towards SDG target 3.4 is the cumulative probability of dying from four NCDs (cancers, cardiovascular diseases, chronic respiratory diseases, and diabetes; referred to as NCD4 hereafter) between exactly 30 years and exactly 70 years of age.
[..] The diverse disease-specific pathways show that reducing the burden of NCDs to achieve SDG target 3.4 requires a combination of prevention, early detection, and treatment. With cardiovascular diseases, chronic respiratory diseases, diabetes, and some cancers requiring large reductions, essential components of any strategy to achieve SDG target 3.4 include tobacco and alcohol control, detection and treatment of hypertension and diabetes, primary and secondary prevention of cardiovascular diseases in high-risk individuals through multidrug treatment, and low-dose inhaled corticosteroids and bronchodilators for asthma and selected patients with chronic obstructive pulmonary disease. Experiences from high-income countries show that these population-based and primary care interventions, although essential and effective on their own do not lead to large enough reductions to achieve SDG target 3.4. Rather, substantially reducing cardiovascular disease and respiratory disease mortality also requires high-quality care, including treatment of acute cardiovascular disease, acute exacerbations of asthma and chronic obstructive pulmonary disease, and acute complications of diabetes, at first-level (eg, district), regional, and specialist hospitals.
The pathways analysis also showed the importance of reducing deaths from cancers for achieving SDG target 3.4. Tobacco control, and, to a lesser extent, alcohol control, are effective interventions against cancers with benefits emerging within a few years. Vaccinations against human papillomavirus and hepatitis B virus are highly effective cancer-prevention measures for cervical and liver cancers, which cause a large number of deaths, especially in low-income and middle-income countries, and should be used in all countries. Although of essential importance, the benefits of immunisation on mortality will materialise decades beyond the current targets. In the interim, leveraging the pathways to SDG target 3.4 requires closing the cancer diagnosis and survival gap between high-income countries and low-income and middle-income countries through screening. This approach will allow earlier diagnosis during precancerous or early stages of disease, followed by treatment of those cancers with effective treatment. An assessment of specific interventions for different NCDs, together with estimates of the costs of these interventions and the opportunities and challenges for their implementation, is detailed in a forthcoming NCD Countdown 2030 analysis.
The diverse national pathways show that accelerating progress towards SDG target 3.4 requires two important considerations. First, national NCD strategies based on the combination of local epidemiology and feasibility, and second, an accessible and equitable health system that integrates population-based prevention with the entire continuum of care—from primary care to secondary and specialist hospital care with effective and efficient referral pathways and the ability to retain patients in long-term care—rather than isolated and vertical programmes. Such an integrated approach is challenging in low-income countries, which continue to face a substantial burden of infectious diseases, epidemic outbreaks (such as Ebola and COVID-19, which influence acute and chronic care for NCDs), and humanitarian crises. Putting in place mechanisms for early diagnosis, appropriate and efficient referral, and long-term care for NCDs would better prepare health systems to deal with other chronic and acute conditions. Creating such a system requires additional financing for NCDs, aligning the NCD agenda with efforts to achieve accessible and equitable national health systems through universal health coverage, and strengthening the capacity for priority setting and implementation of NCD care within the health system.”
NCD Countdown 2030: pathways to achieving Sustainable Development Goal target 3.4, NCD Countdown 2030 Collaborators. Lancet 2020.9.3
2020.9.3
“Insurers’ payment policies have long struggled with structuring incentives for cost-effective—yet expensive—curative procedures and treatments. A new proposed rule from the Centers for Medicare and Medicaid Services (CMS) helps address this by modifying the Medicaid Drug Rebate Program (MDRP) to facilitate pharmaceutical value-based contracts (VBCs) in Medicaid programs. Given how the MDRP shapes drug pricing policy, the proposed rule will have a large impact and will allow for more pharmaceutical VBCs in ways that should benefit Medicaid beneficiaries. However, there are challenges with the proposed rule, and we suggest alternative pathways to achieve the same goal of paying for therapeutic performance.
[..] Enacted in 1990, the MDRP, otherwise known as the Medicaid best-price rule, requires manufacturers—as a condition of receiving Medicaid coverage of their products—to provide a rebate for all outpatient prescription drugs taken by beneficiaries. Set in statute, the rebate provides the best price available in the private market or a certain percentage of the drug’s average manufacture price, whichever is greater. In response, Medicaid programs are required to have an open formulary (ie, they must include all of the manufacturer’s drugs). Because pharmaceutical VBCs are designed to pay manufacturers only if an individual patient responds positively to a therapy, the best price under the MDRP regulations if a patient fails to respond to a treatment could theoretically be no charge at all. Understandably, this has inhibited manufacturers’ willingness to participate in pharmaceutical VBCs.
The proposed rule allows manufacturers to support multiple prices if a therapy is tied to a pharmaceutical VBC, defining VBCs as an arrangement aligning payment with evidence-based and outcome-based measures, which “substantially” links payment to performance. Reported as a bundled sale, the MDRP best price would be the average, weighted net price provided, including any discounts from the pharmaceutical VBC (as opposed to an individual best price). Under the proposed regulatory change, a therapeutic that failed to achieve any measurable outcomes would drive the price down but not to zero. The rule also extends the time to make pricing revisions beyond the existing 36-month time frame, as new therapeutics have long-term benefits beyond 3 years. Finally, taking into account concerns that manufacturers would use an exception to drive other therapeutics through a value-based platform with higher launch prices coupled with minor discounts, the proposed rule both uses and seeks stakeholder input as to meaningful interpretations of substantial in defining a pharmaceutical VBC. In conclusion, the proposed rule provides state Medicaid programs with enhanced flexibility to enter into pharmaceutical VBCs, while private payers and manufacturers may enter into pharmaceutical VBCs without the risk of triggering disincentivizing MDRP best-price rules (ie, a price of $0).
[..] The proposed rule contains a number of regulatory definitions, which can age poorly and yield unintended negative consequences. Recent examples include potential increased mortality associated with the 30-day Hospital Readmissions Reduction Program and challenges with postacute care access resulting from the 3-day rule.
Instead, there are alternative policy approaches to accomplish the goal of enabling pharmaceutical VBCs. Noting that—despite the proposed rule—some stakeholders have continued to highlight the need for greater flexibility to enable pharmaceutical VBCs, it may be easier to redefine best price as a set of best pricing options, facilitating long-term flexibility and helping counteract “gaming” as market conditions change. Under this approach, Medicaid would receive the best set of outcomes and rebates (or options set) that manufacturers provide to other payers in other VBCs. Manufacturers would thus report existing contracts, reducing administrative burden, while CMS would avoid the aforementioned definitional challenges.
Another option is statutory change, given that rulemaking is frequently subject to legal challenge (as has happened with price transparency) and not infrequently proves unstable across presidential administrations. By instead adding a statutory exemption to or modifying the MDRP definition of best price to ensure that Medicaid receives the best set of pricing options, Congress could eliminate barriers and support Medicaid’s transition to value-based agreements for curative therapeutics, increasing access and improving quality of life for impoverished, disabled, and vulnerable people in the US.”
Exceptions for Exceptional Cures—Modernizing the Medicaid Drug Rebate Program, Miller BJ and Zima SC. JAMA Health Forum 2020.8.31
Excerpt – To understand health plan mortality effects, [Jason] Abaluck and his co-authors focused on the Medicare Advantage market, which covers about a third of all Medicare beneficiaries and allows them to pick from a variety of privately managed plans subsidized by the government. Participants have lots of options: in 2010, for example, 33 different Medicare Advantage plans operated in a typical U.S. county. The researchers’ data set included more than 15 million Medicare Advantage enrollees and the plans offered to them between 2006 and 2011.
[..] Abaluck and his co-authors looked for a creative way to approximate a randomized controlled trial. Plan terminations, they realized, offered just such an opportunity. Sometimes Medicare Advantage plans are terminated, forcing enrollees to pick a new option, creating “a kind of experiment,” Abaluck says.
Of particular interest to the researchers was the fate of people forced to leave plans with especially low and especially high mortality rates. These individuals tended to end up in plans with more middle-of-the-road morality rates.
If the terminated plans had low mortality rates because they happened to have healthy enrollees, you’d expect to see those individuals’ mortality rates stay the same when they moved into new plans. But if the plans themselves were affecting health outcomes, then you’d expect to see mortality rates change as patients switched plans.
And that’s exactly what Abaluck and his co-authors found: “If people are reassigned from a good plan to an average plan, they get much sicker. If they are reassigned from a bad plan, they get much healthier,” Abaluck says.
So why aren’t consumers all opting for the most life-prolonging plans? While mortality rates aren’t publicly available, there is other information to guide consumers in their choices—most notably, star ratings from the Centers for Medicare and Medicaid Services (CMS), a measure of quality you might expect would correlate with mortality.
But it turns out that CMS star ratings, which are calculated based on factors including customer satisfaction, have no relationship to mortality rates. “Whether a plan has five stars or two stars tells you nothing about whether that plan is likely to make you live longer,” Abaluck says. In other words, one of the few pieces of information consumers have when making their choice doesn’t help them select plans with low mortality rates.
In fact, the researchers found only one easily accessible piece of information that corresponded with plan mortality rates: price. Plans with higher premiums and more generous prescription drug coverage “do appear to have better outcomes,” Abaluck notes, though most of the variation in whether plans extend your life is not explained by these factors.
To Abaluck, the research suggests several ways to make the Medicare Advantage work better for Americans. For example, regulators could simply remove the plans with the highest mortality rates from the market. Eliminating the worst 5% of plans, the researchers estimate, could save around 10,000 elderly lives each year. The government could also require plans to provide life insurance—creating a strong financial incentive to meaningfully improve the health of enrollees.
And CMS could change how it calculates star ratings to include mortality rates. This is important not just because it would better inform consumers, but also because star ratings also affect the rate at which plans are reimbursed by the government. “Let’s reimburse plans based on what we actually care about,” Abaluck says, “which is whether they make people live longer.”
Mortality Effects and Choice Across Private Health Insurance Plans, Abaluck J, Bravo MMC, Hull P, Starc A. National Bureau of Economic Research, July 2020.
Choosing the wrong health insurance could kill you, Allen S. Medical Xpress 2020.9.3
“Cardiac rehabilitation (CR) is an essential component in the secondary prevention of coronary artery disease (CAD), with proven reductions in cardiovascular and all-cause mortality. Exercise plays an important role as cardiorespiratory fitness (measured as volume of oxygen consumption [VO2] peak) exerts the largest influence on cardiovascular disease prognosis in this population. High-intensity interval training (HIIT) has shown superior improvements in VO2 peak compared with moderate-intensity continuous training (MICT) in patients with CAD.
[..] The HIIT protocol involved 4 × 4-minute high-intensity intervals corresponding to a rating of perceived exertion (RPE) of 15 to 18 on the Borg 6 to 20 scale, interspersed with 3-minute active recovery intervals (RPE of 11 to 13). The MICT protocol involved usual care exercise of 40-minute moderate-intensity exercise at an RPE of 11 to 13. Participants were instructed to complete 3 sessions of their allocated training per week (2 supervised and 1 home-based session) during the 4-week CR program and then to continue home-based training (at least 3 sessions per week of their allocated training) for a further 11 months. [Participants were also provided a HR range that corresponded to the respective target RPE, in order to reinforce adherence with the exercise intensity. The HR range for the HIIT group was 85-95%HRpeak and 65-75%HRpeak for the MICT group. Exercise intensity was recorded as average training RPE, peak training RPE, average training %HRpeak, and peak training %HRpeak as previously suggested. The intensity during the recovery intervals were not monitored.]
[..] Of 93 randomized participants, 78 (84%) were male, the mean (SD) age was 65 (8) years, and 46 were randomized to HIIT and 47 to MICT. Dropout rates between HIIT (12 of 46 [26%]) and MICT (8 of 47 [17%]) were not different over 12-month follow-up (P = .32).
[..] Following the 4-week supervised program, VO2 peak increased by 10% with HIIT and 4% with MICT (mean [SD] oxygen uptake: HIIT, 2.9 [3.4] mL/kg/min; MICT, 1.2 [3.4] mL/kg/min; mean difference [MD], 1.7 mL/kg/min; P = .02) (Table 2). This was similar for VO2 peak normalized for lean body mass (mean [SD] oxygen uptake: HIIT, 4.1 [4.9] mL/kg/min [10% improvement]; MICT, 1.0 [5.0] mL/kg/min [2% improvement]; MD, 3.1 mL/kg/min; P = .004). After 12-month follow-up, participants in the HIIT and MICT groups showed similar improvement in VO2 peak from baseline, with a 10% improvement in the HIIT group and a 7% improvement in the MICT group (mean [SD] oxygen uptake: HIIT, 2.9 [4.5] mL/kg/min; MICT, 1.8 [4.3] mL/kg/min; MD, 1.1 mL/kg/min; P = .30).
[..] Average training RPE was higher for HIIT compared with MICT (mean [SD] RPE: HIIT, 16.3 [1.3]; MICT, 12.4 [0.6]; P < .001), as was average training heart rate as a percentage of peak heart rate (mean (SD) percentage: HIIT, 87% [6]; MICT, 71% [8]; P < .001). In stage 2 (home-based training), average training RPE was maintained at similar levels despite reduced supervision. Exercise adherence was high during the initial supervised stage (HIIT, 39 of 44 [91%]; MICT, 39 of 43 [91%]; P > .99) and reduced over the 12-month study period (HIIT, 18 of 34 [53%]; MICT, 15 of 37 [41%]; P = .35), with no differences between groups. After 6 months of home-based training, we observed a reduction in the number of participants training at the prescribed intensity, with 15 of 39 participants in the MICT group (38%) exercising at a higher intensity on their own accord and 9 of 37 participants in the HIIT group (24%) exercising at a lower intensity. Based on adherence to attendance and intensity, per-protocol analysis showed that HIIT was superior to MICT for improving VO2 peak at 12 months (HIIT, 5.2 [4.1] mL/kg/min [18% improvement]; MICT, 2.2 [4.1] mL/kg/min [8% improvement]; MD, 3.0 mL/kg/min; P = .02).
[..] The greater efficacy of HIIT for improving VO2 peak compared with MICT during supervised training (MD, 1.7 mL/kg/min) is similar to previous meta-analyses reporting group differences of 1.5 to 1.6 mL/kg/min. This is clinically meaningful, as each 1–mL/kg/min improvement in VO2 peak during a CR program has been associated with a 6% reduction in hospital readmissions and 13% reduction in all-cause mortality. At 12 months, both groups showed similar improvement in VO2 peak; however, the MD between HIIT and MICT of 1.1 mL/kg/min could be considered clinically meaningful.”
Short-term and Long-term Feasibility, Safety, and Efficacy of High-Intensity Interval Training in Cardiac Rehabilitation: The FITR Heart Study Randomized Clinical Trial, Taylor JL, Holland DJ, Keating SE et al. JAMA Cardiology 2020.9.2
“Digital mental health interventions (DMHIs), using Internet-based and mobile tools, can be cost-effective and have potential to improve capacity of health care settings to address mental health problems. However, implementation in primary care has often failed, primarily because patients do not use the tools.
[..] Computer-delivered DMHIs are primarily based on evidence-based therapies, rely heavily on psychoeducation, and typically require use for 30 to 45 minutes per week for 6 or more weeks. Despite good efficacy in randomized clinical trials (RCTs), real-world engagement is challenging. In contrast to computers, people tend to use smartphone apps for a single purpose, in short bursts of time, sometimes frequently throughout the day. Thus, app-based DMHIs often focus on 1 to 2 psychological strategies and more on actions than psychoeducation. App-based DMHIs have demonstrated efficacy in RCTs, are increasingly used by the public, and produce reasonable early engagement, but adherence drops dramatically over the first 2 weeks.
[..] The IntelliCare platform was designed to address these challenges. Rather than a single app, the platform contains multiple apps, each of which is brief, simple, and supports a single clinical target. For example, the Daily Feats app targets goal-setting; the sole activity is setting and monitoring completion of daily goals, with scaffolding to increase complexity. Because depression and anxiety are highly comorbid and respond to similar psychological strategies, the platform was designed to address both conditions.
[..] patients were eligible if they had a compatible smartphone (Android or Apple) and elevated symptoms of depression or anxiety at screening (score ≥10 on the Patient Health Questionnaire-8 [PHQ-8] or ≥8 on the Generalized Anxiety Disorder-7 scale [GAD-7]). Individuals were excluded, among others, if they were acutely suicidal, had a diagnosis for which the IntelliCare study might not be appropriate, and were currently in or scheduled to initiate psychotherapy to avoid treatment interference. Psychotropic medication was permitted if dose was stable over the past 2 weeks to eliminate medication placebo effects.
[..] Following randomization, participants in the intervention condition began IntelliCare via an onboarding telephone call with their assigned coach. Wait list control participants were informed they would have access to IntelliCare after an 8-week delay. All participants were prompted to complete assessments every 4 weeks for 16 weeks, administered online and independent of the intervention to mask outcomes to coaches. Participants could receive up to $100 for completing the research assessments.
[..] The intervention was delivered over 8 weeks using the coach-supported IntelliCare platform. IntelliCare is a suite of mobile apps available on iPhone and Android operating systems. The Hub app organized the user experience by supporting access to clinically focused IntelliCare apps, providing a library of psychoeducational material, and administering a weekly symptom assessment. In this study, participants received access to 5 clinically focused apps. [The five apps were
- Daily Feats: focuses on goal-setting
- Day-to-Day: focuses on positive psychology lessons via psychoeducation and prompts
- MyMantra: focuses on self-affirmations and personal values
- Thought Challenger: focuses on cognitive restructuring/reframing
- WorryKnot: focuses on emotion regulation and anxiety exposure]
[..] Each week, a coach recommended a new app to download and try, based on the participant’s preferences and a recommendation protocol. Participants were encouraged to try the newly recommended app but could download any app at any time and use or discontinue apps as preferred.
[..] Coaches were 2 bachelor’s degree–level individuals who received training in the coaching manual26 and weekly supervision with a clinical psychologist. Coaching was delivered primarily via short message service text messaging; coaches typically initiated 2 contacts per week and responded to participants’ messages. Participants also received a welcome packet via email (developed with health literacy experts), 1 onboarding telephone call (approximately 30-45 minutes), and the offer for an optional midtreatment call (approximately 10-15 minutes).
[..] After adjusting for age, sex, and race, the effect of group by treatment interaction remained significant for depression (F2,34 315 = 15.3; P < .001). The LSM difference in depression scores at week 4 was 2.91 (SE = 0.83; ESd = 0.43) and at week 8 was 4.37 (SE = 0.83; d ES = 0.64). Similarly, the group by treatment interaction remained significant for anxiety (F2,3228.4 = 11.9; P < .001). The LSM difference in anxiety scores at week 4 was 2.51 (SE = 0.78; d ES = 0.41) and at week 8 was 3.33 (SE = 0.76; d ES = 0.55).
[..] At 8 weeks following treatment, 119 participants (81.5%) had some app use. For all participants, postintervention median time to last app use was 28 days (range, 0-212 days) and median days used was 7 (range, 0-102 days).
[..] Among those with depression, coaches sent a mean of 32 messages (SD, 9; range, 7-61); participants sent a mean of 19 messages (SD, 12; range, 1-68). There was a negligible correlation between change in PHQ-9 and number of messages from coaches (r, −0.07; 95% CI, −0.25 to 0.13) or participants (r, −0.03; −0.22 to 0.16). Among those with anxiety, coaches sent a mean of 32 messages (SD, 10; range, 7-61); participants sent a mean of 19 messages (SD, 12; range, 1-68). The correlation between change in GAD-7 and number of messages from coaches (r, −0.01; 95% CI, −0.19 to 0.17) or participants (r, −0.02; 95% CI, −0.20 to 0.17) was not meaningful.
[..] Effect sizes of 0.78 and 0.64 for depression and anxiety in this trial are in the range of effect sizes in meta-analyses of face-to-face psychotherapy (0.69 and 0.84, respectively) and compare favorably with effect sizes for app-based treatments (0.38 and 0.33, respectively) and web-based interventions evaluated in primary care (0.31 and 0.26, respectively).
[..] While we are unaware of mental health app adherence data in primary care, the median number of mental health app sessions is 3 to 9 among active public users. In contrast, we found high app use, with a median of 93 to 98 app sessions across all apps over 8 weeks. Our findings may be because the platform approach matches how people use apps: participants could use or ignore apps as preferred, and the novelty of receiving new apps is likely engaging. The sample also comprised a group rarely represented in technology research: in contrast to past research, which has tended to attract those drawn to technology, participants were from a diverse, traditionally underserved community seeking help for depression and anxiety. Thus, findings suggest this service appealed to patients more generally and underscore the importance of designing DMHIs to match patients’ app use preferences. App use was not strongly associated with outcomes, consistent with much of the DMHI literature. The association between use and outcomes is complex. Clinically meaningful app engagement may be more important than raw quantity. Furthermore, people tend to use DMHIs less as their depression improves. Taken together, the relative high engagement suggests that platform approaches, such as IntelliCare, may be more acceptable to patients and likely produce better outcomes than disorder-focused single apps; however, this remains to be tested in a trial.”
Coached Mobile App Platform for the Treatment of Depression and Anxiety Among Primary Care Patients: A Randomized Clinical Trial, Graham AK, Greene CJ, Kwasny MJ et al. JAMA Psychiatry, 2020.5.20
“Patients 35 to 82 years of age were eligible if they had any evidence of coronary disease on invasive coronary angiography or computed tomography angiography or a coronary-artery calcium score of at least 400 Agatston units on a coronary-artery calcium scan. Patients were required to have been in a clinically stable condition for at least 6 months before enrollment. Patients were not eligible if they had moderate-to-severe renal impairment, severe heart failure, severe valvular heart disease, or known side effects from colchicine.
[..] The primary end point was a composite of cardiovascular death, spontaneous (nonprocedural) myocardial infarction, ischemic stroke, or ischemia-driven coronary revascularization. Secondary end points, which were tested in hierarchical fashion, were ranked in the following order: the composite of cardiovascular death, spontaneous myocardial infarction, or ischemic stroke (key secondary end point); the composite of spontaneous myocardial infarction or ischemia-driven coronary revascularization; the composite of cardiovascular death or spontaneous myocardial infarction; ischemia-driven coronary revascularization; spontaneous myocardial infarction; ischemic stroke; death from any cause; and cardiovascular death.
[..] Among the 6528 patients who provided written informed consent and started the open-label run-in period, 5522 underwent randomization and 5478 received at least one dose of colchicine or placebo. Among the 1006 patients (15.4%) who had started the run-in period but did not undergo randomization, the most common reason was gastrointestinal upset (in 437 patients).
[..] The primary composite end-point event of cardiovascular death, spontaneous myocardial infarction, ischemic stroke, or ischemia-driven coronary revascularization occurred in 187 patients (6.8%) in the colchicine group and in 264 patients (9.6%) in the placebo group, with incidence rates of 2.5 and 3.6 events, respectively, per 100 person-years (hazard ratio, 0.69; 95% confidence interval [CI], 0.57 to 0.83; P<0.001). This treatment effect was consistent in the on-treatment analysis.
[..] A key secondary composite end-point event of cardiovascular death, spontaneous myocardial infarction, or ischemic stroke occurred in 115 patients (4.2%) in the colchicine group and in 157 patients (5.7%) in the placebo group, with incidence rates of 1.5 and 2.1 events, respectively, per 100 person-years (hazard ratio, 0.72; 95% CI, 0.57 to 0.92; P=0.007). In the prespecified hierarchical testing of the ranked secondary end points, the rates of the first five secondary end points, including spontaneous myocardial infarction, were significantly lower in the colchicine group than in the placebo group. Colchicine did not result in a lower incidence of death from any cause than placebo (73 vs. 60 fatalities; incidence, 0.9 vs. 0.8 events, respectively, per 100 person-years; hazard ratio, 1.21; 95% CI, 0.86 to 1.71).
[..] The incidence rates of death from any cause and noncardiovascular death were higher with colchicine than with placebo. The observed between-group difference in the incidence of noncardiovascular death was not significant, as shown by the 95% confidence interval, and could have been due to chance, although the hazard ratio of 1.51 is of potential concern. The individual causes of death do not permit a clear interpretation of this finding.”
Colchicine in Patients with Chronic Coronary Disease, Nidorf SM, Fiolet ATL, Mosterd A et al. NEJM 2020.8.31
“Adults (≥18 years of age) who had chronic heart failure (functional class II, III, or IV) with a left ventricular ejection fraction of 40% or less were eligible to participate in the trial. All the patients were receiving appropriate treatments for heart failure, including diuretics, inhibitors of the renin–angiotensin system and neprilysin, beta-blockers, mineralocorticoid receptor antagonists, and, when indicated, cardiac devices. [..] We limited the number of patients who had an ejection fraction of more than 30% by requiring a history of hospitalization for heart failure within the previous 12 months or a particularly high level of N-terminal prohormone of brain natriuretic peptide (NT-proBNP), including a level of at least 1000 pg per milliliter in those with an ejection fraction of 31 to 35% or a level of at least 2500 pg per milliliter in those with an ejection fraction of 36 to 40%, as compared with a level of at least 600 pg per milliliter in those with an ejection fraction of 30% or less.6 These NT-proBNP thresholds were doubled in patients with atrial fibrillation.
[..] After a screening period of 4 to 28 days, patients who fulfilled the eligibility criteria were randomly assigned in a 1:1 ratio to receive either empagliflozin (at a dose of 10 mg daily) or placebo in addition to their usual therapy for heart failure. The dose of empagliflozin was selected on the basis of the reduction in the risk of cardiovascular death or hospitalization for heart failure that had been previously reported with this dose in patients with type 2 diabetes.
[..] Every 2 to 3 months, we evaluated patients at trial visits to assess outcomes and adverse events. We periodically evaluated vital signs, body weight, glycated hemoglobin level, NT-proBNP level, and renal function. In addition, we assessed the patients’ quality of life using the Kansas City Cardiomyopathy Questionnaire. We reevaluated the estimated GFR 23 to 45 days after the discontinuation of empagliflozin or placebo in order to allow for an evaluation of the effect of treatment independent of the presence of the SGLT2 inhibitor. All the patients were followed for the occurrence of prespecified outcomes for the entire duration of the trial, regardless of whether they were adherent to the trial regimens or procedures.
[..] The primary outcome was a composite of adjudicated cardiovascular death or hospitalization for heart failure, analyzed as the time to the first event. The first secondary outcome was the occurrence of all adjudicated hospitalizations for heart failure, including first and recurrent events. The second secondary outcome was the rate of the decline in the estimated GFR during double-blind treatment.
[..] The primary composite outcome of death from cardiovascular causes or hospitalization for heart failure occurred in 361 patients (19.4%) in the empagliflozin group and in 462 patients (24.7%) in the placebo group (hazard ratio, 0.75; 95% confidence interval [CI], 0.65 to 0.86). The hazard ratios for the effect of empagliflozin on cardiovascular death and on the first hospitalization for heart failure were 0.92 (95% CI, 0.75 to 1.12) and 0.69 (95% CI, 0.59 to 0.81), respectively. During the trial period, the number of patients who would need to have been treated with empagliflozin to prevent one primary event was 19 (95% CI, 13 to 37).
[..] Among the patients who were receiving sacubitril–valsartan at baseline, the hazard ratio for the comparison between empagliflozin and placebo for the primary outcome was 0.64 (95% CI, 0.45 to 0.89), as compared with 0.77 (95% CI, 0.66 to 0.90) among those who were not receiving sacubitril–valsartan.
[Patients randomized to the empagliflozin group had about a 0.16% drop in A1C, 2.36 % rise in hematocrit and 0.82 drop in kilograms of body weight. They also had a 50% reduction in the composite renal outcome (chronic dialysis, renal transplantation or a sustained reduction of 40% or more in estimated GFR or sustained estimated GFR of less than 15 ml/min/1.73 m2 in those with a baseline estimated GFR of less than 30 ml/min/1.73 m2), a 1.7 point improvement on the Kansas City Cardiac Questionnaire (100-point scale), 15% reduction in all-cause hospitalizations with no statistical change in all-cause mortality or new onset of diabetes among those with prediabetes.]
[..] Overall, in this trial, empagliflozin was associated with a lower combined risk of cardiovascular death or hospitalization for heart failure than placebo and with a slower progressive decline in renal function in patients with chronic heart failure and a reduced ejection fraction, regardless of the presence or absence of diabetes.”
Click here for earlier posts.